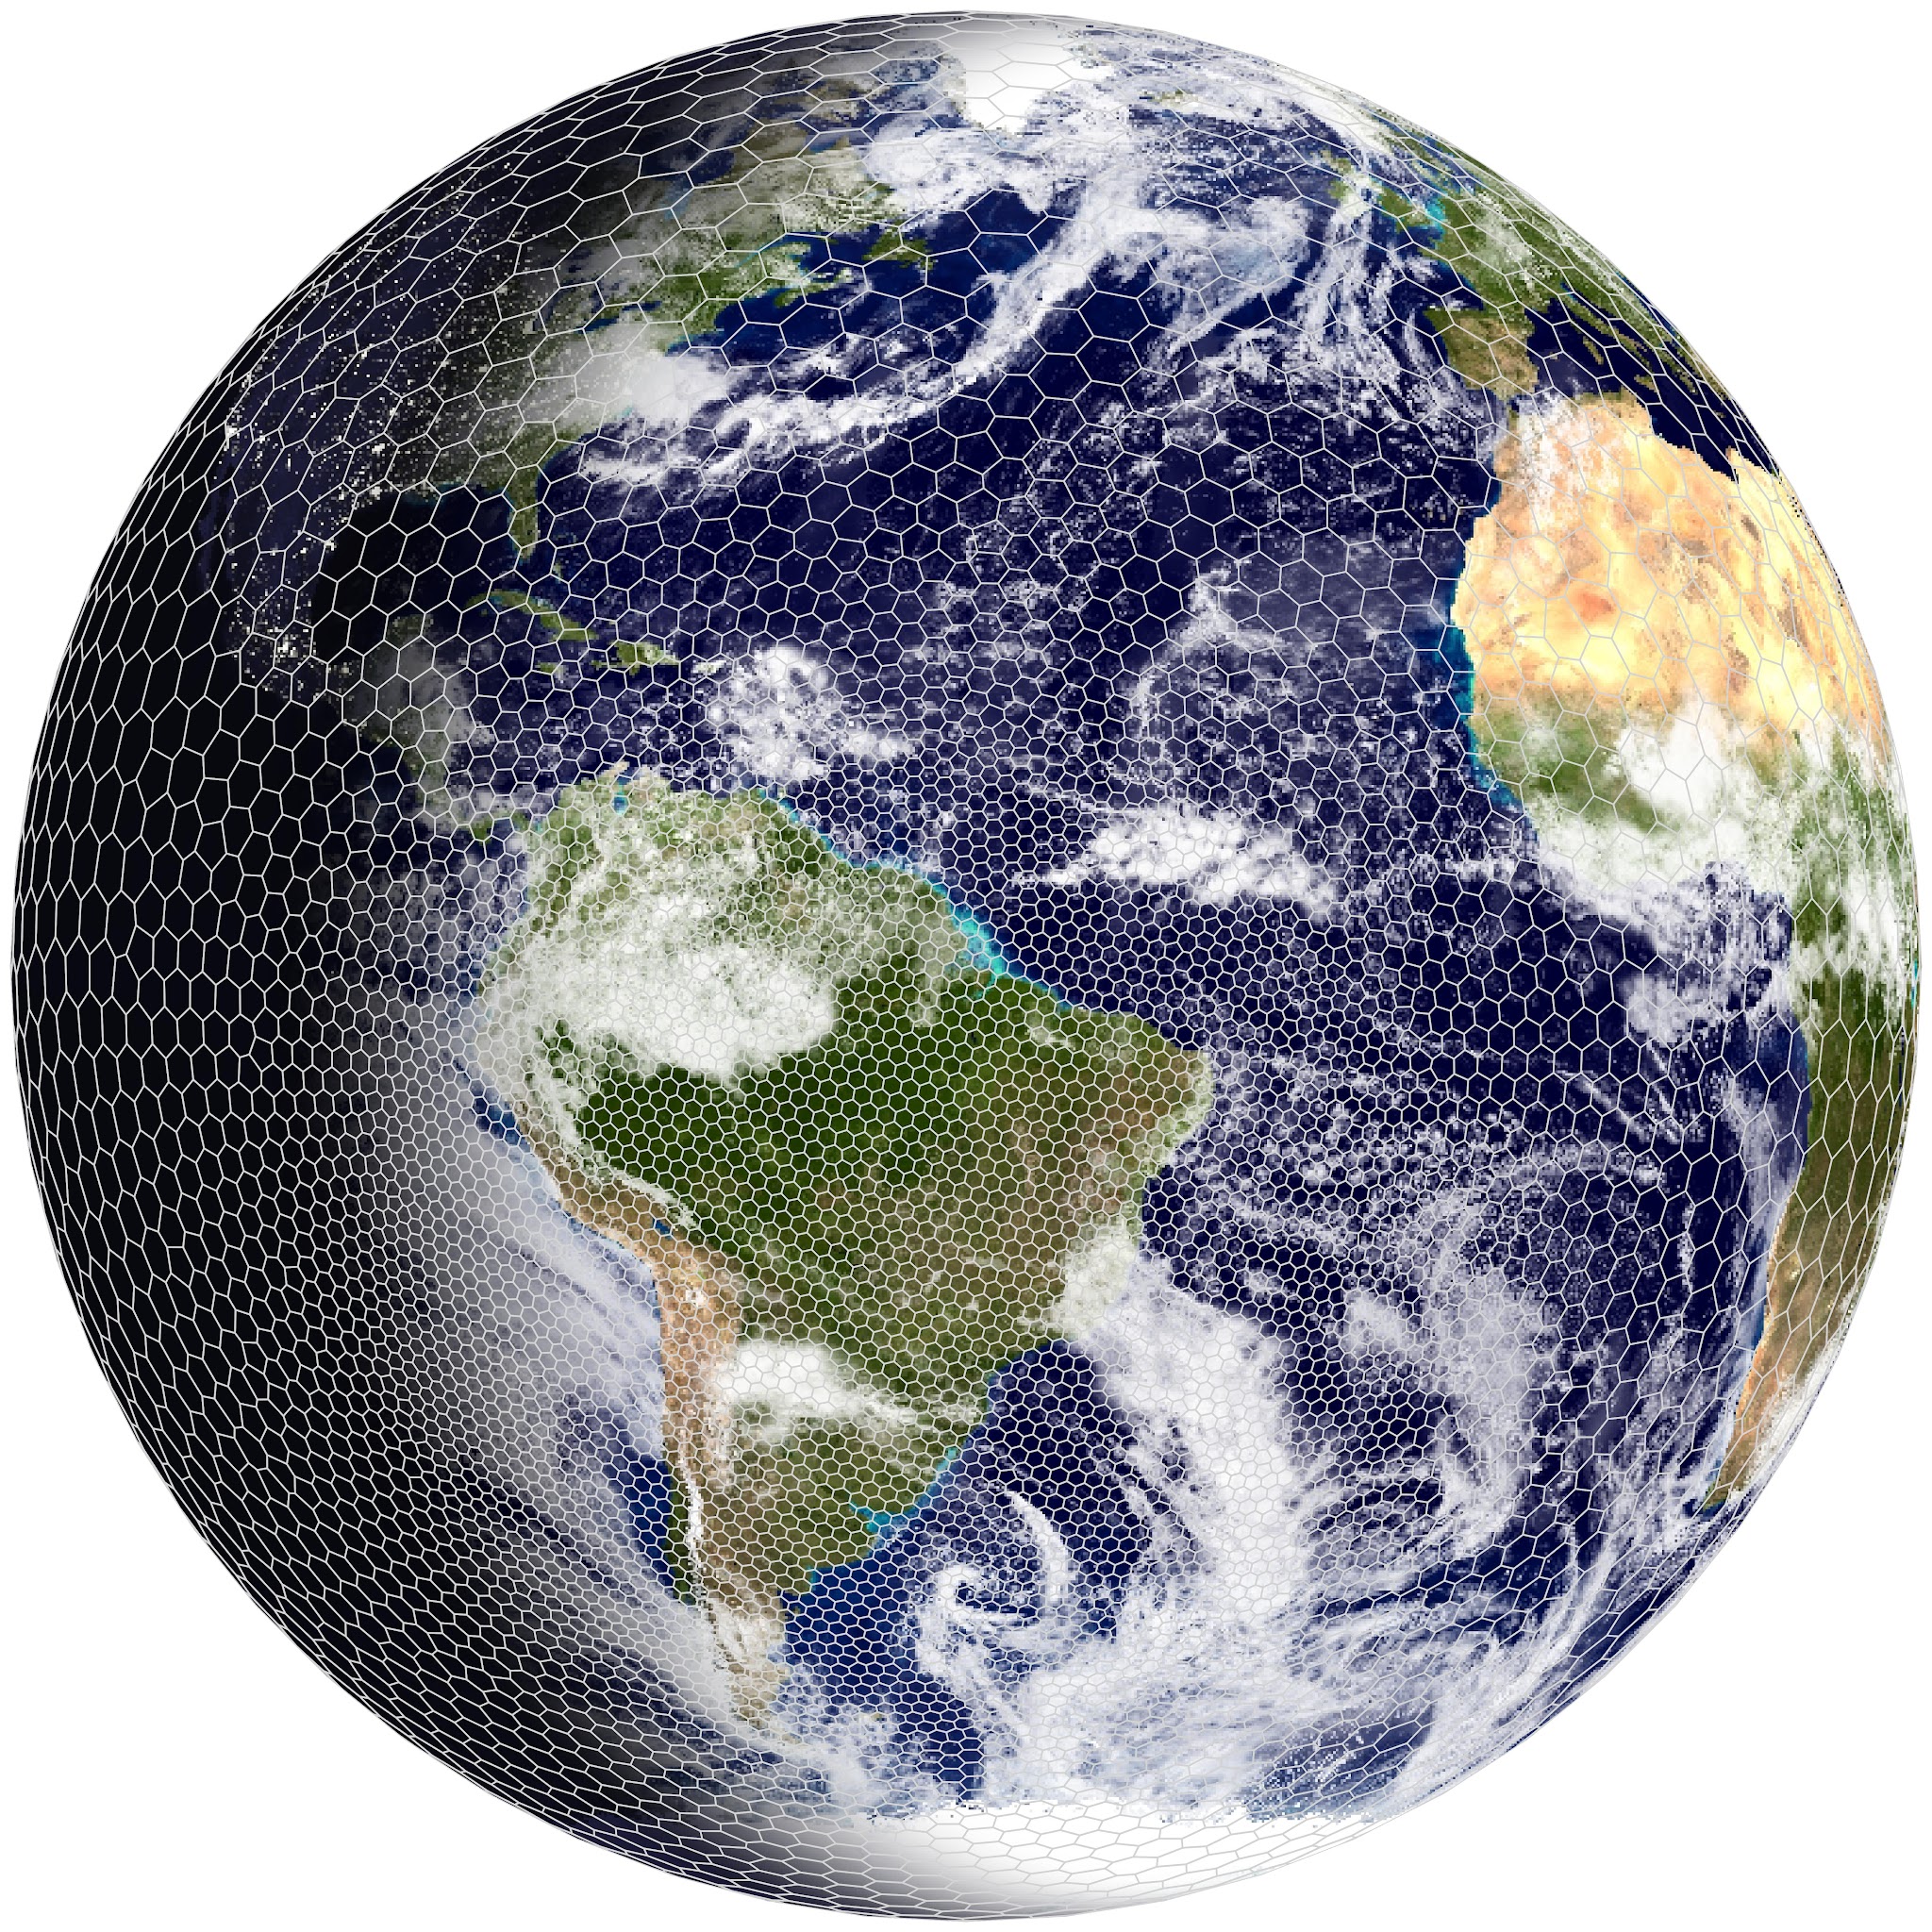
November 2026 · Politecnico di Milano
A historical overview of atmosphere and ocean dynamics
Atmosphere and Ocean Dynamics — Lecture 1
Prof. Dr. Pedro da Silva Peixoto
Applied Mathematics
Instituto de Matemática e Estatística
Universidade de São Paulo
Visiting Professor at MOX Lab
Politecnico di Milano
Atmosphere and ocean dynamics
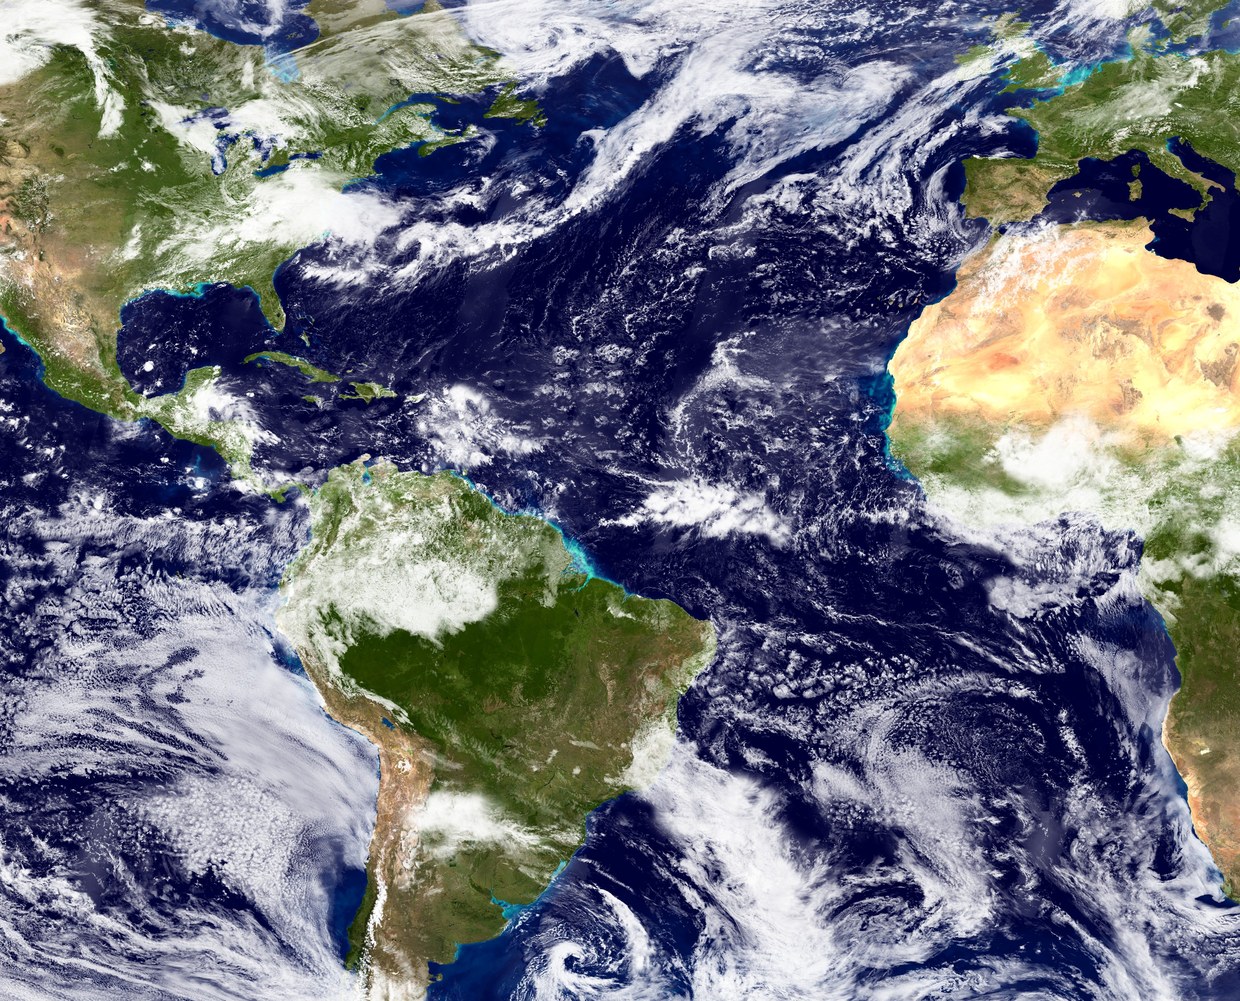 Clouds seen by the satellite instrument MODIS: NASA Blue Marble (2002)
Why do the winds blow mostly westward in the tropics, and eastward at higher latitudes?
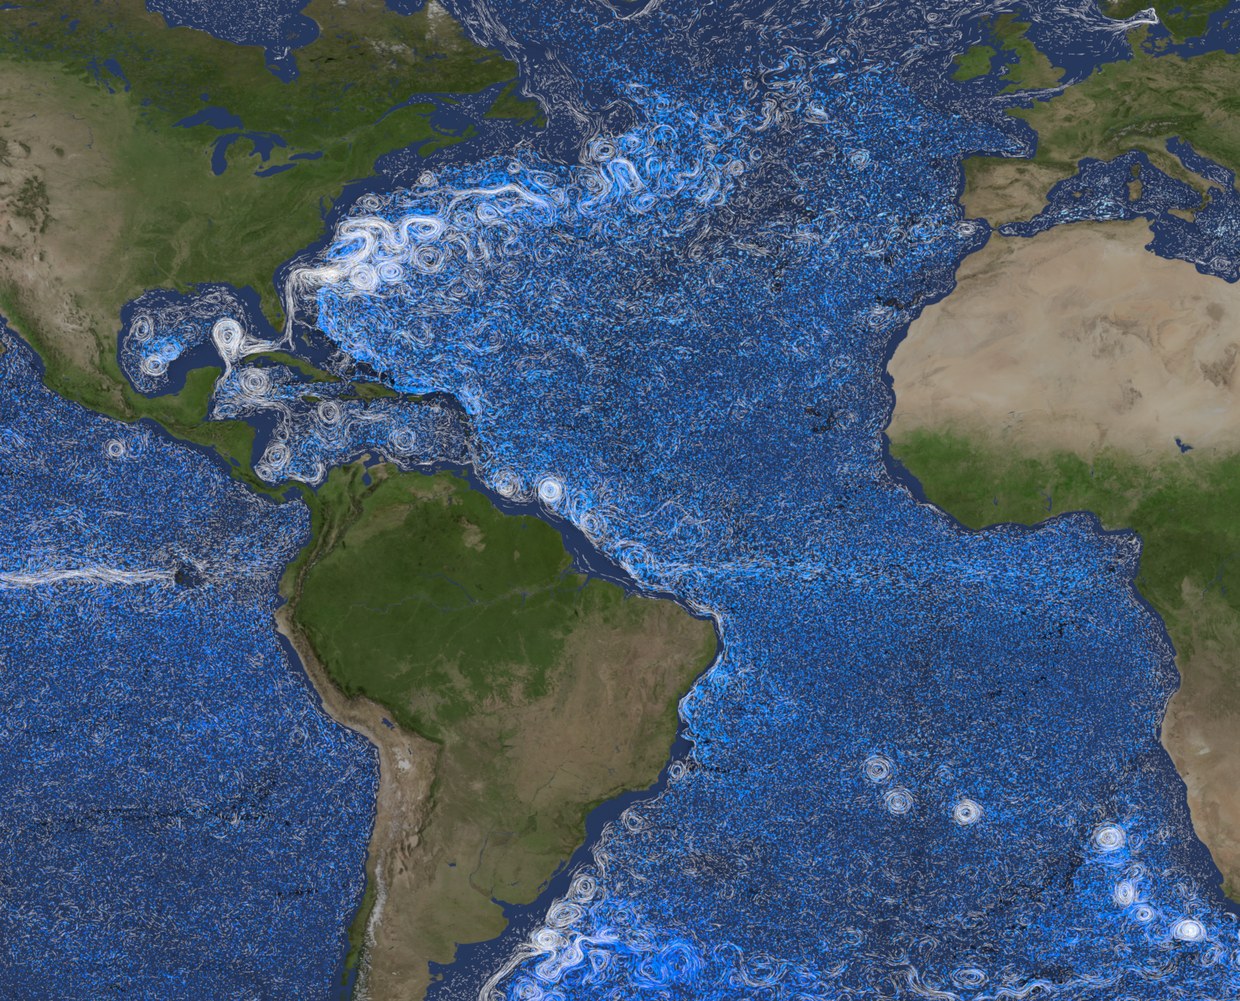 Currents from the ECCO2 ocean model: NASA Scientific Visualization Studio
Why is the fast, narrow current on the western side of the Atlantic Ocean, off America and not off Europe?
Can we model and forecast this?
Goals: Understand and model the large-scale motions of thin layers of air and water on a rotating planet
Figures: commons.wikimedia.org: Land_ocean_ice_cloud_hires.jpg (NASA Blue Marble) · svs.gsfc.nasa.gov/5479 (Perpetual Ocean 2)

Scales of motion
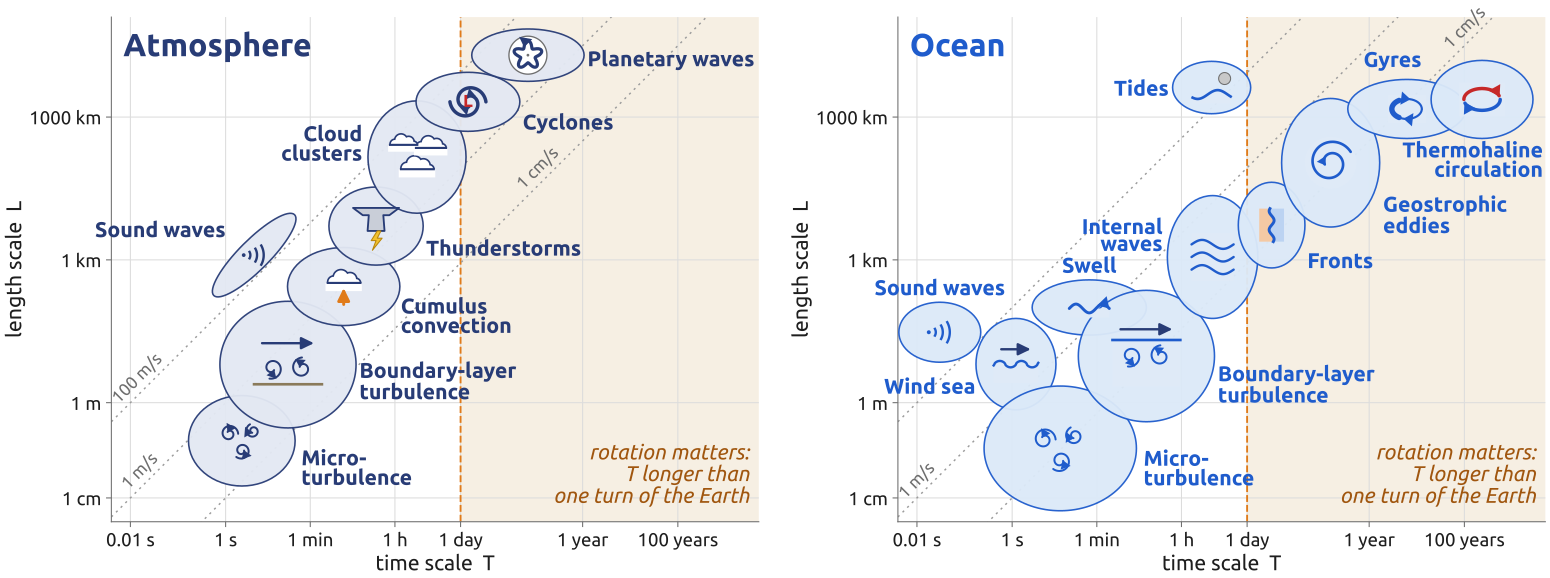
Each ellipse: the typical length \(L\) and time \(T\) of a phenomenon (symbols not to scale); dotted lines: speed \(U = L/T\)
Large motions are slow, and the ocean is about 100 times slower than the air; the Earth’s rotation matters for motions that last longer than a day
Figure redrawn after Fig. 1.7 of Cushman-Roisin and Beckers (2011) (diagram by H. von Storch); text: its sec. 1.5, 1.7 and Table 1.2
Torricelli, Pascal (1643–48): the weight of the air
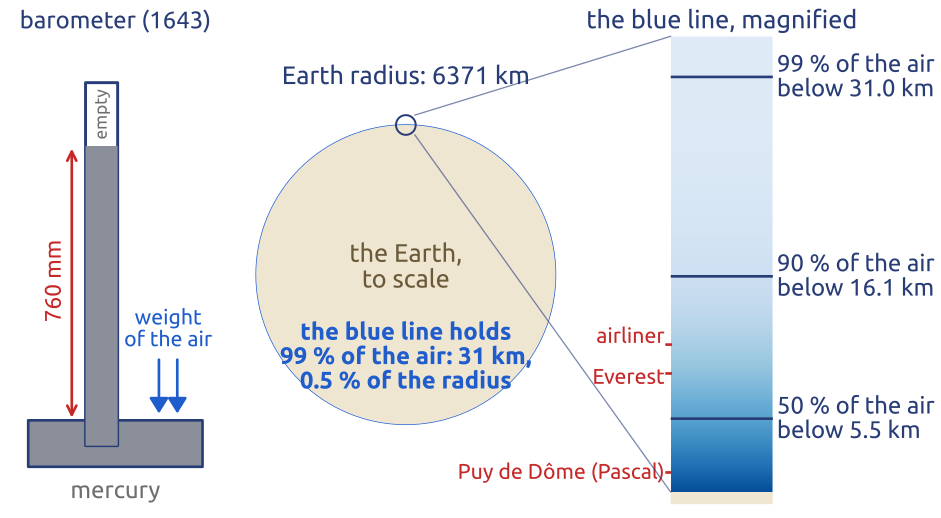
- Torricelli: the air has weight: it holds up 760 mm of mercury (the barometer)
- Pascal: on the Puy de Dôme the mercury stood about 8.5 cm lower (Périer’s climb, 1648): less air above
- Pressure is the weight of the air above, per unit area: the air is a thin skin
\[\frac{\partial p}{\partial z} = -\rho g\]
\(p\): pressure; \(z\): height; \(\rho\): density of the air; \(g\): gravity, 9.81 m/s²
Pressure is the weight of the air above; the air is a thin skin, half of it below 5.5 km
(Pascal 1648; Vallis 2017, sec. 1.3.3; NOAA et al. 1976)
Boyle (1662): the spring of the air
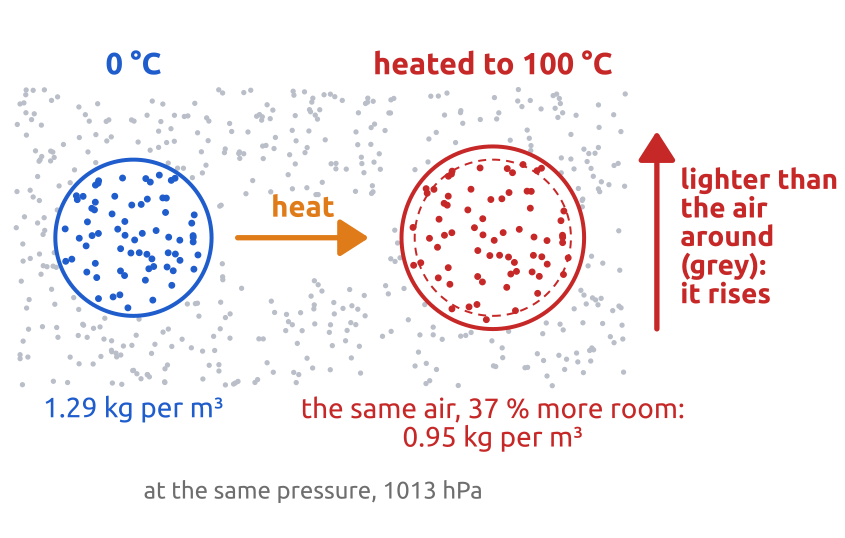
- Boyle’s law (1662): squeeze air and its pressure rises: at the same temperature, pressure × volume stays the same
- Heated air expands: warm air is lighter, and rises; Halley (1686): “rarified, and less ponderous”
- The exact law, at any temperature, came later: Charles’s and Gay-Lussac’s laws (around 1800)
\[p = \rho R T\]
\(p\): pressure; \(\rho\): density; \(T\): temperature (K); \(R = 287\) J/(kg K) for dry air
The gas law ties pressure, density and temperature: warm air is lighter, and rises
(Halley 1686, 165; Vallis 2017, sec. 1.4)
Halley (1686): the Sun drives the winds
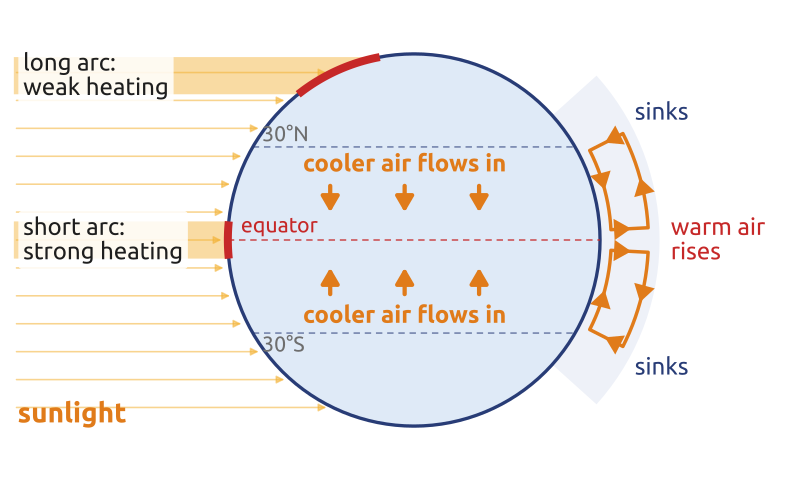
- Heated air rises, cooler air flows in
The Halley of the comet, back every 75–76 years.
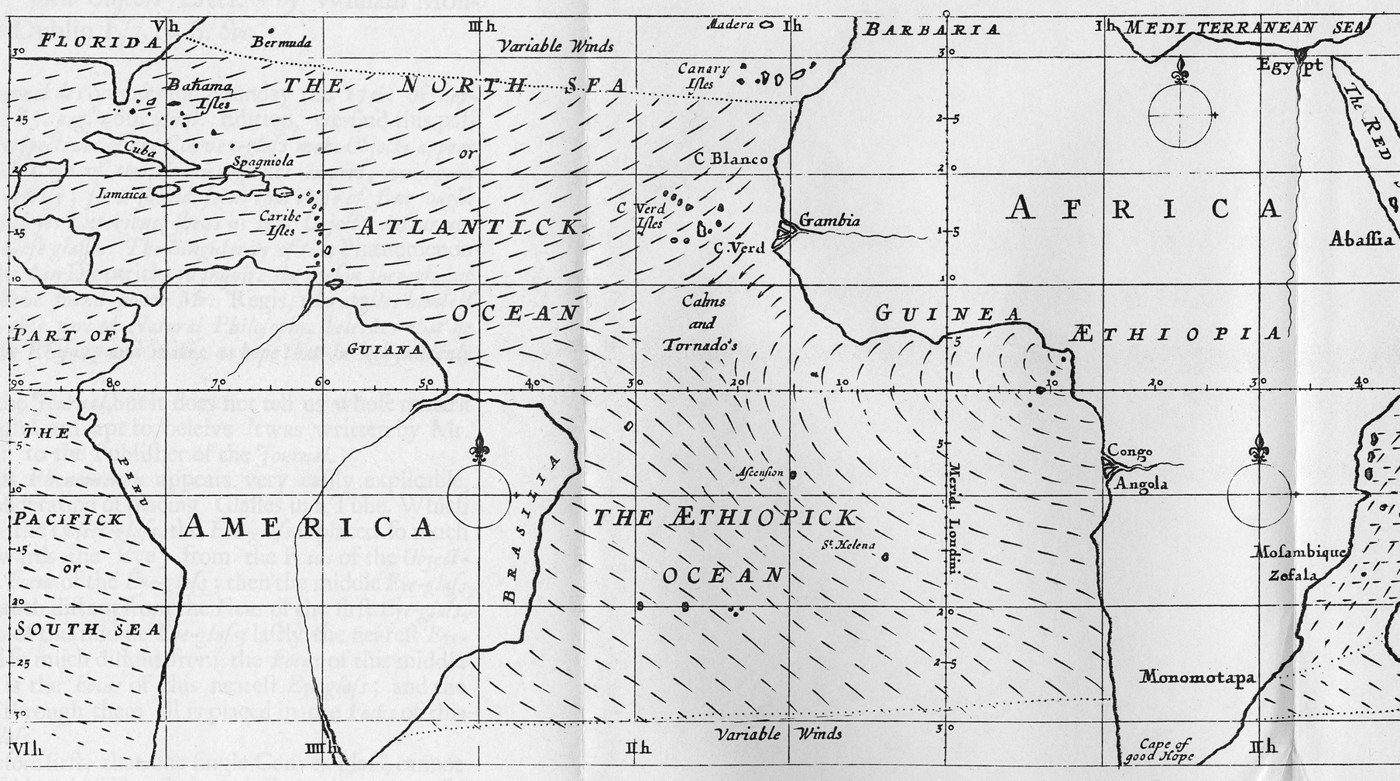
Halley’s map of the trade winds (Atlantic part).
Halley (1686), Philosophical Transactions; scan: Princeton University Library
- But the trade winds blow westward: why?
- Halley: the Sun’s daily westward motion?
Dynamics: the tropics gain heat, the poles lose it: winds and currents carry it poleward
(Halley 1686, 165–67; Lorenz 1983, 731) · Map: commons.wikimedia.org: Edmond Halley’s map of the trade winds, 1686

Newton (1687): motion and gravity
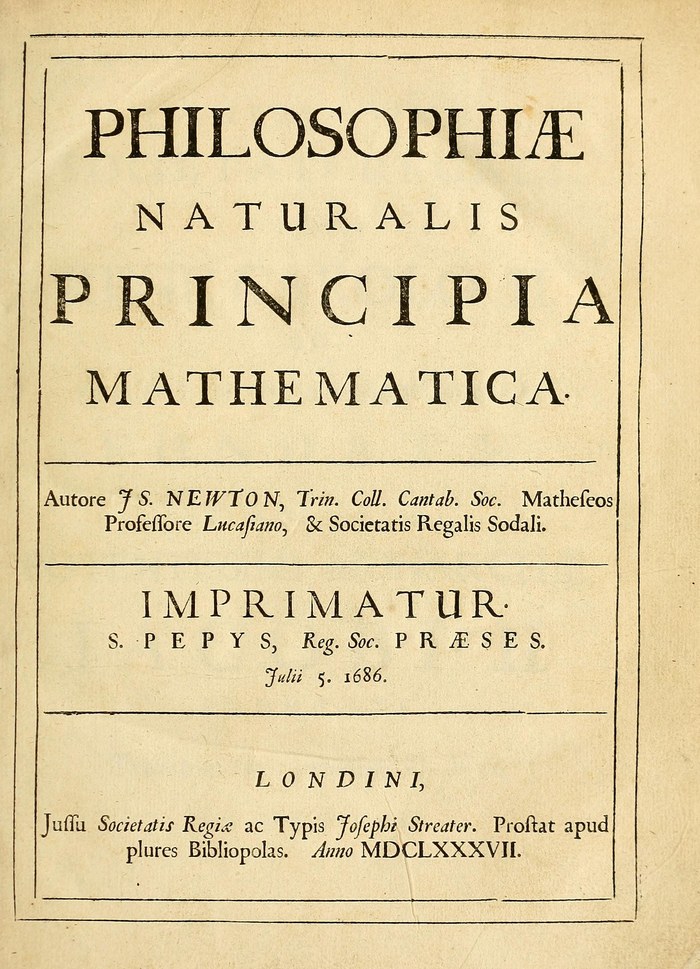
Principia, first edition, London, 1687. Public domain
- First law (inertia): a body keeps its velocity unless a force acts on it, seen from the fixed stars, not from the turning ground
- Second law: force = mass × acceleration; Euler (1755) will write it for every parcel of a fluid
- Gravitation: every mass attracts every other: the weight of the air, and the Moon’s pull on the ocean
- Halley persuaded Newton to write the Principia and paid for its printing
\[\underbrace{\mathbf{F} = m\,\mathbf{a}}_{\text{second law}} \qquad\qquad \underbrace{F = \frac{G\,m_1 m_2}{r^2}}_{\text{universal gravitation}}\]
\(\mathbf{F}\): force; \(m\): mass; \(\mathbf{a}\): acceleration; \(G\): gravitational constant; \(m_1, m_2\): masses at distance \(r\)
Halley’s question again: with no east–west push, air moving towards the equator keeps its motion in space, while the ground under it turns faster. What wind does it feel?
Newton’s laws: the physics under every model, and the key to Halley’s question
(Newton 1687) · Title page: commons.wikimedia.org: Newton’s Principia title page · Book: archive.org: Principia (1687)

Hadley (1735): rotation turns the winds
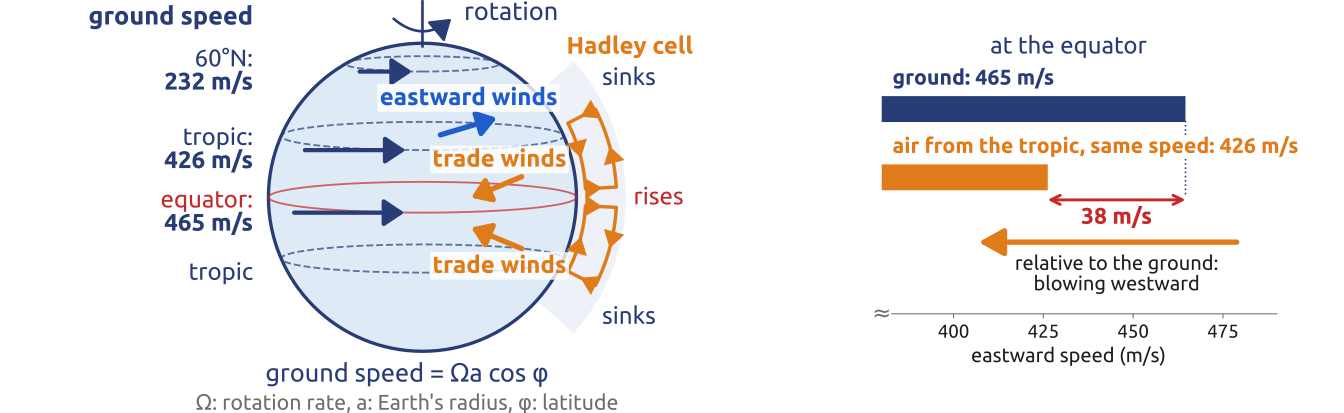
- Air moving towards the equator lags behind the ground: a wind blowing westward, the trade winds
- Air moving towards the poles runs ahead of the ground: a wind blowing eastward
- But 38 m/s is a storm: why?
- Hadley: surface friction
The Earth’s rotation, not the Sun’s motion, “turns” the winds
(Hadley 1735; Persson 2006)
Angular momentum
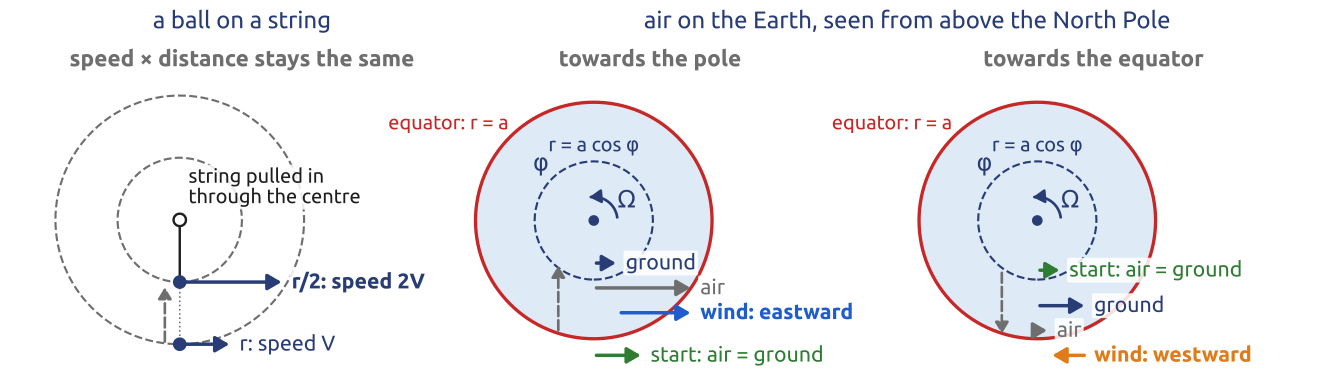
What it means: per unit mass, \(m = r\,V\): distance \(r\) to the axis × speed \(V\) around it. A pull towards the axis does not change it.
On the Earth (radius \(a\), rotation rate \(\Omega\), latitude \(\varphi\)): \(r = a\cos\varphi\), \(\;V\) = ground \(\Omega a\cos\varphi\) + wind \(u\) (westward if \(u<0\)): \(m = (\Omega a\cos\varphi + u)\,a\cos\varphi\)
Conservation of angular momentum, following the moving air: with no east–west push, \(Dm/Dt = 0\).
Towards a pole the air runs ahead of the ground, towards the equator it lags behind
(Persson 2006, 32; Vallis 2017, sec. 14.2)
Newton’s tide and the real ocean
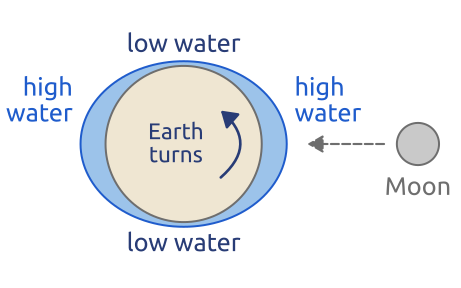
Newton (1687), the equilibrium tide: high water under the Moon, twice a day; M2 amplitude about 25 cm at the equator, less towards the poles.
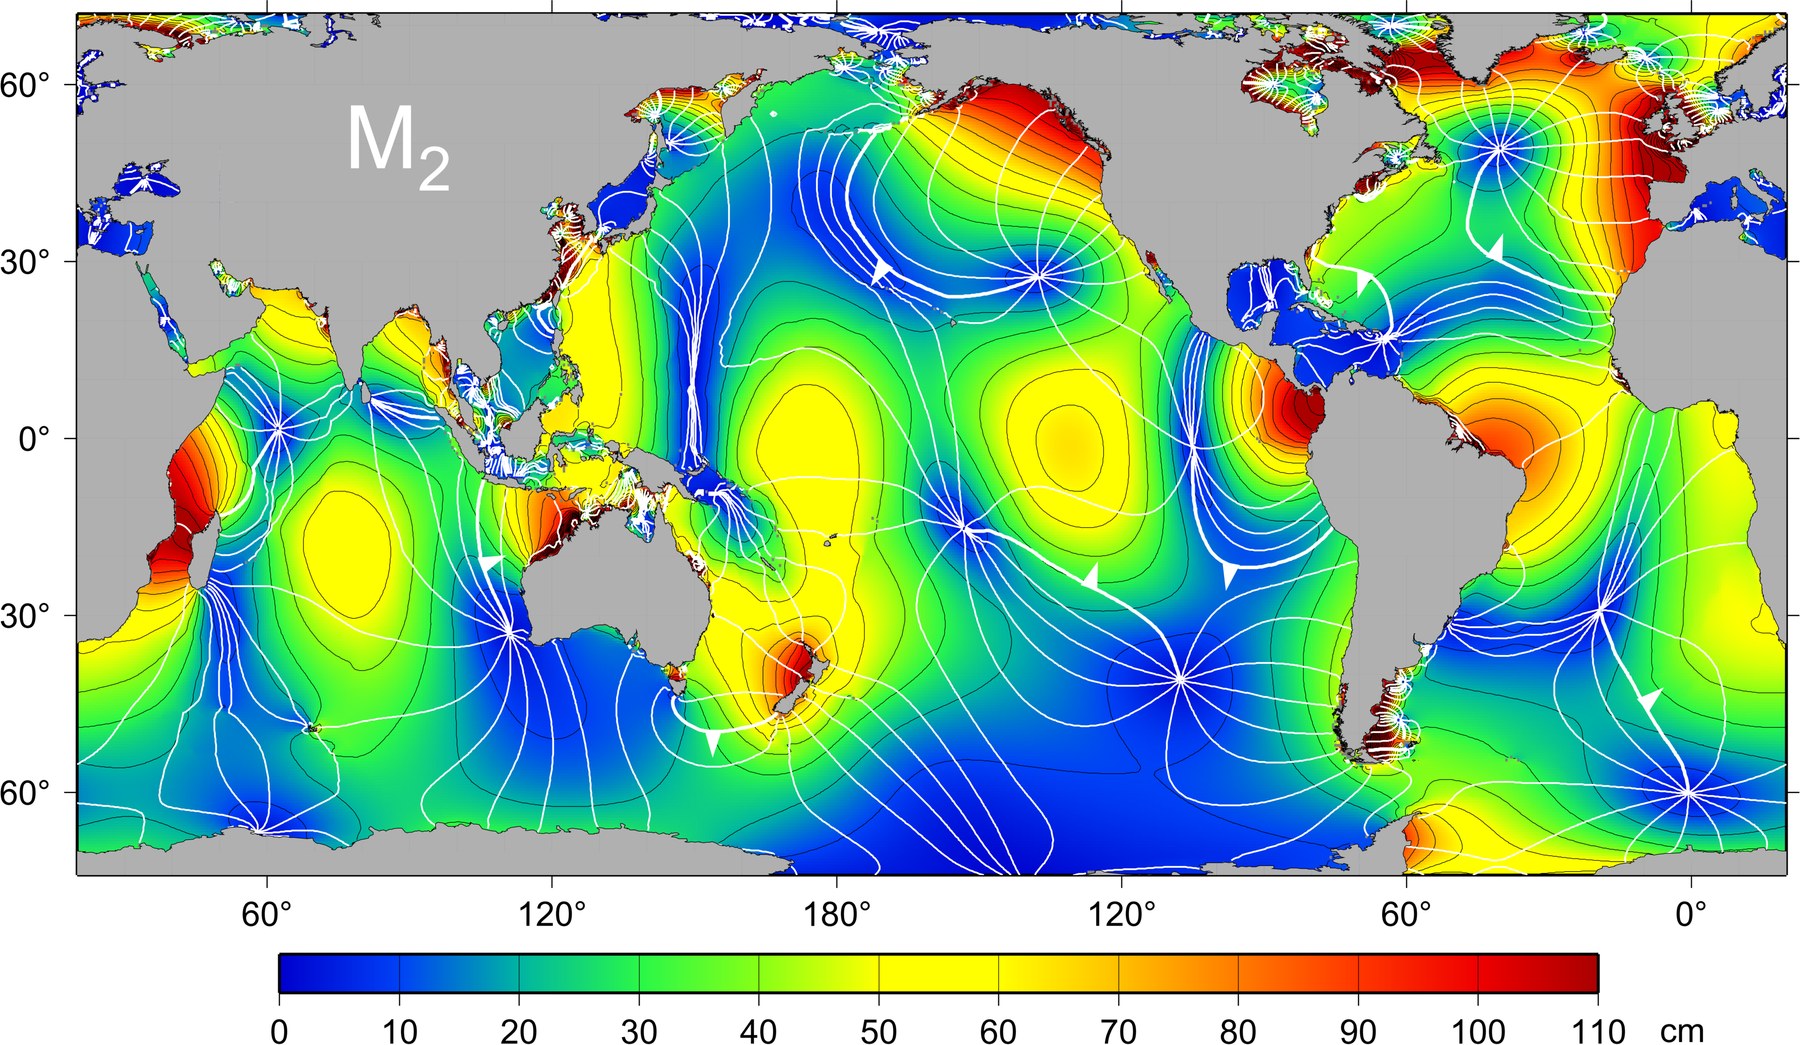
Observed: principal lunar semidiurnal tide (M2)
R. Ray, NASA Goddard Space Flight Center, from TOPEX/Poseidon satellite data
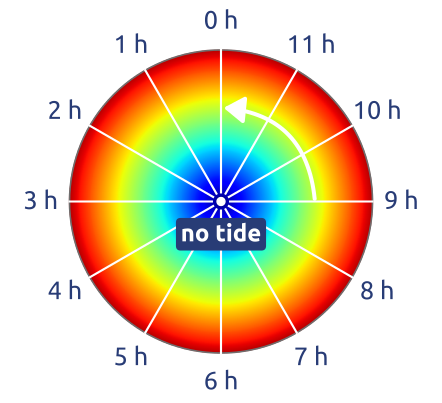
How to read it: colours, amplitude; white lines, high water at the same time, one hour apart. It turns around a point with no tide, the amphidromic point.
But: high water hours late, tides several times larger, points with no tide: the ocean moves as a fluid.
The Moon sets the rhythm; the ocean sets the size and the timing of the tide
(Hendershott 1981) · Map: commons.wikimedia.org: M2_Tidal_constituent.tif
Euler (1755): the equations of a fluid
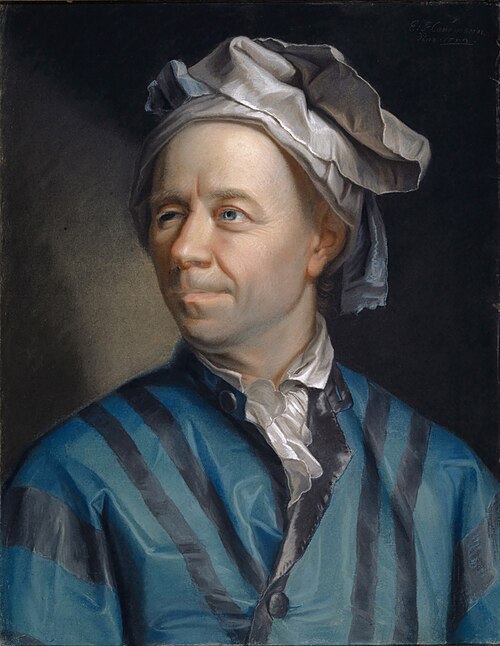
Leonhard Euler (1707–1783), by J. E. Handmann (1753). Public domain
- The fluid as a continuum: a velocity, a pressure and a density at every point
- Newton’s second law for every small parcel: mass × acceleration = pressure force + weight
- Mass is kept: what flows out of a small box empties it
\[\frac{D\mathbf{u}}{Dt} = -\frac{1}{\rho}\nabla p - \nabla\Phi, \qquad \underbrace{\frac{\partial\rho}{\partial t} + \nabla\cdot(\rho\mathbf{u}) = 0}_{\text{continuity equation}}\]
\(\mathbf{u}\): velocity; \(D/Dt\): change following a parcel; \(p\): pressure; \(\rho\): density; \(\Phi\): geopotential (gravity)
Newton’s laws for every parcel of a fluid: the base of every weather and ocean model
(Euler 1757; Vallis 2017; Chorin and Marsden 1993, sec. 1.1) · Portrait: commons.wikimedia.org: Leonhard Euler

Laplace (1776): the tides of a rotating ocean
- The ocean responds: tides are waves on a rotating Earth
- Too slow to follow the Moon: the point under the Moon moves at ~450 m/s, a tidal wave at \(\sqrt{gH} \approx 200\) m/s
\[\begin{aligned} \frac{\partial \mathbf{u}}{\partial t} + f\,\mathbf{k}\times\mathbf{u} &= -g\nabla(\eta - \eta_{eq})\\ \frac{\partial \eta}{\partial t} + \nabla\cdot(H\mathbf{u}) &= 0 \end{aligned}\]
\(\eta\): sea level; \(\mathbf{u}\): current; \(H\): depth; \(f = 2\Omega\sin\varphi\): the rotation; \(\eta_{eq}\): Newton’s tide (the forcing)
The linear shallow water equations.
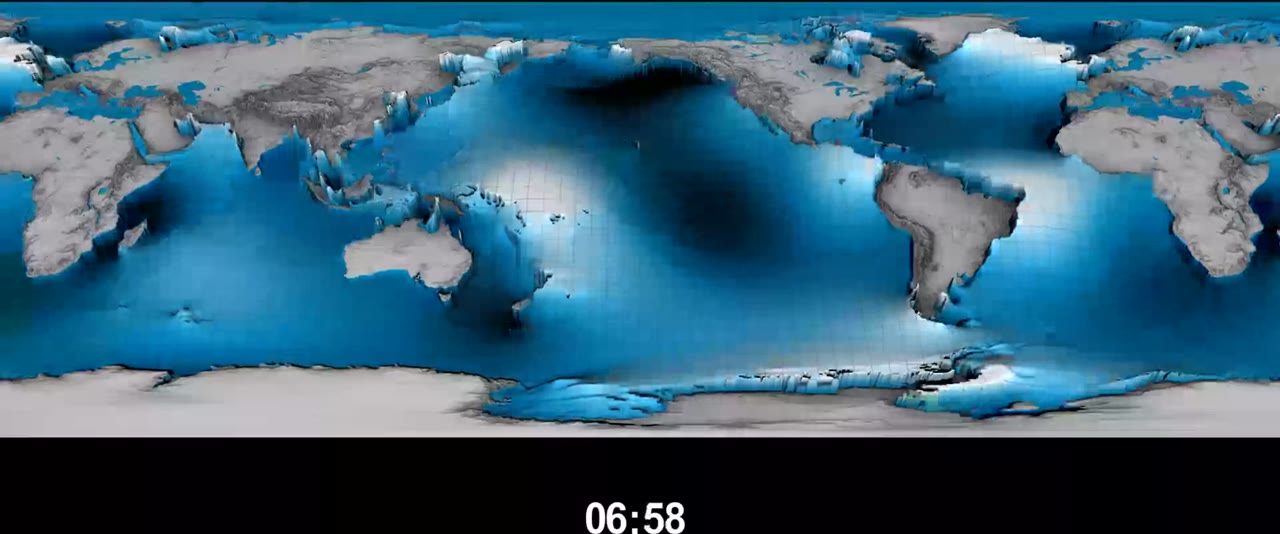
The global tide (mostly M2) over one day: high water turns around the amphidromic points.
NASA Goddard Scientific Visualization Studio (R. Ray, G. Shirah)
The tides are not a static bulge: they are waves in a rotating ocean
(Hendershott 1981) · Animation: svs.gsfc.nasa.gov/4821
Navier (1822), Stokes (1845): friction
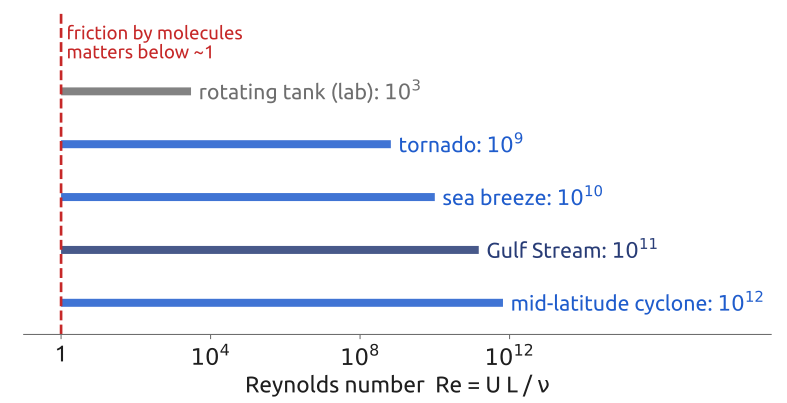
- Euler’s fluid has no friction. Navier, Stokes: add the friction between layers of fluid (the viscosity \(\nu\)): the Navier–Stokes equations
- How much it matters: the Reynolds number \(Re = UL/\nu\) (Reynolds, 1883)
- Winds and currents: \(Re \sim 10^{8}\)–\(10^{12}\): molecular friction is negligible, but the flow is turbulent, and eddies mix strongly
\[\frac{D\mathbf{u}}{Dt} = -\frac{1}{\rho}\nabla p - \nabla\Phi + \nu\nabla^2\mathbf{u}\]
\(\nu\): kinematic viscosity (air \(1.5\times10^{-5}\), water \(10^{-6}\) m²/s); \(\mathbf{u}\), \(p\), \(\rho\), \(\Phi\): as in Euler
Molecular friction is negligible at large scales; turbulence is not, and must be modelled
(Navier 1827; Stokes 1845; Reynolds 1883; Cushman-Roisin and Beckers 2011, sec. 4.5)
Carnot (1824), Clausius (1850): heat and work
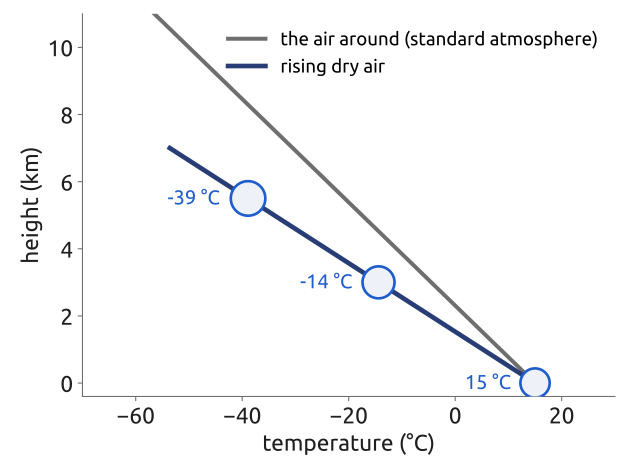
- Carnot (1824): heat engines. Clausius (1850): heat and work, and the first law of thermodynamics, the conservation of energy: heating a parcel raises its temperature, or makes it expand
- Rising air expands and cools, faster than the air around it usually does: cold mountain tops, clouds in rising air
\[c_p\frac{DT}{Dt} - \frac{1}{\rho}\frac{Dp}{Dt} = Q\]
\(T\): temperature; \(p\): pressure; \(\rho\): density; \(c_p = 1004\) J/(kg K): specific heat; \(Q\): heating per unit mass
Heat and motion are tied: rising air expands and cools
(Clausius 1850; Wallace and Hobbs 2006, ch. 3)
Coriolis (1835): a planar rotating frame (disk)
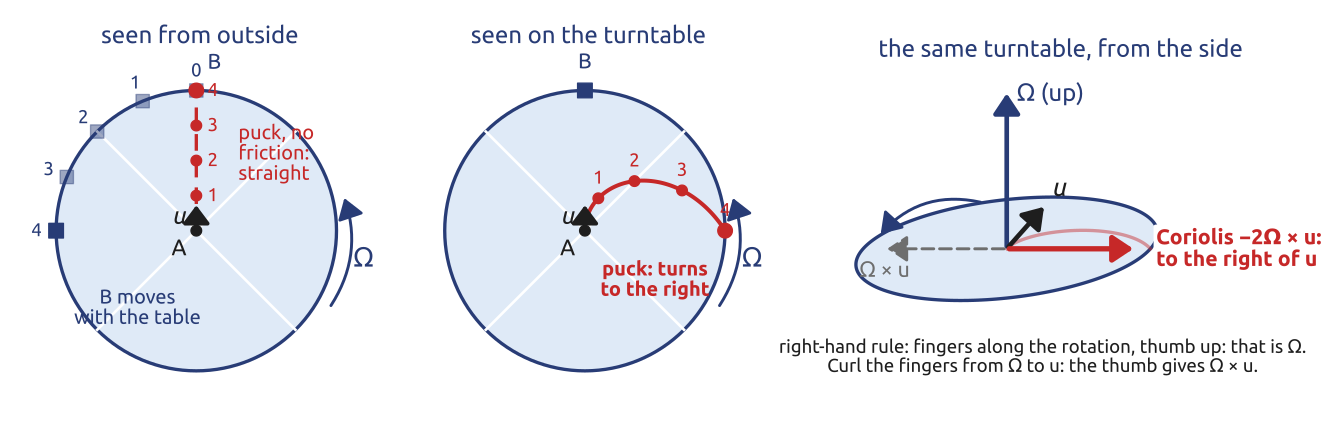
- Newton’s laws hold in a frame that does not turn; we measure winds on the turning Earth
- Seen from the Earth: the Coriolis force \(-2\boldsymbol{\Omega}\times\mathbf{u}\)
Laplace (1776) had it for the tides; Coriolis made it general.
\[\frac{D\mathbf{u}}{Dt} + 2\boldsymbol{\Omega}\times\mathbf{u} = -\frac{1}{\rho}\nabla p - \nabla\Phi\]
\(\boldsymbol{\Omega}\): Earth’s rotation; \(\mathbf{u}\): velocity on the Earth; \(p\), \(\rho\), \(\Phi\): pressure, density, geopotential
The Coriolis force turns moving air and water; it never speeds them up
(Coriolis 1835; Persson 1998)
Foucault (1851): the local rotation
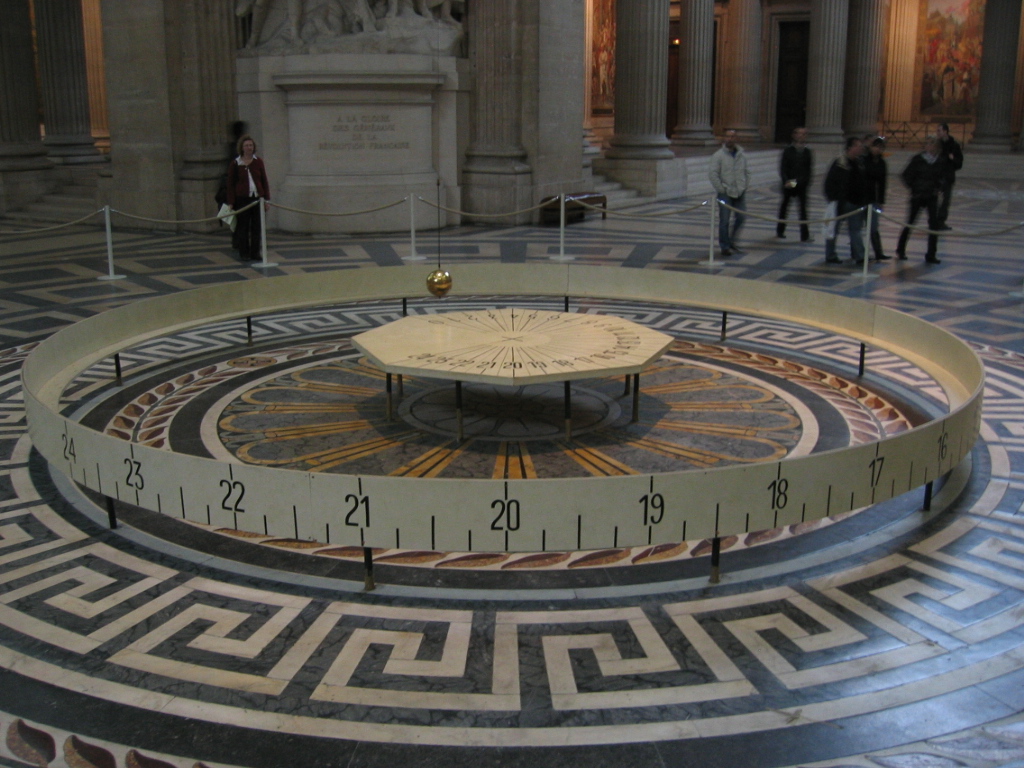
The pendulum in the Panthéon (today’s copy). Arnaud 25, Wikimedia Commons · ▶ videos (online): in Italian, short
- The bob swings in a fixed plane: nothing pushes it sideways
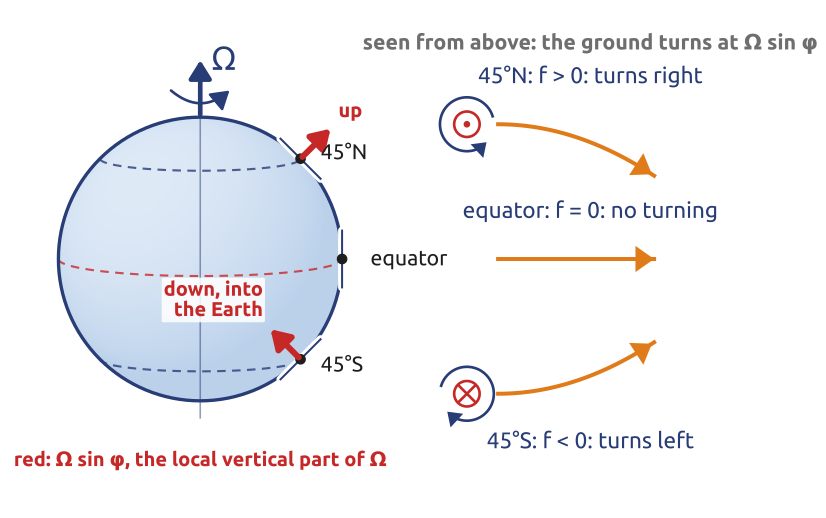
- Under it, the floor turns with the Earth itself, at \(\Omega\sin\varphi\) (Paris: \(\varphi = 48.9^\circ\)N)
- Seen from the floor, the swing turns clockwise: once in \(24\,\mathrm{h}/\sin 48.9^\circ \approx 32\) h (Milan: 34 h)
The Coriolis parameter \(f = 2\Omega\sin\varphi\) turns motion right in the northern hemisphere, left in the southern
(Foucault 1851; Persson 1998) · Photo: commons.wikimedia.org: Pendule de Foucault.jpg · Videos: youtu.be/oyH5438wBcU, youtu.be/59phxpjaefA

The Coriolis force in components
Horizontal motion feels only the part of \(\boldsymbol{\Omega}\) along the local vertical \(\mathbf{k}\):
\[\begin{aligned} \frac{d\mathbf{u}}{dt} &= -2\boldsymbol{\Omega}\times\mathbf{u} \;\to\; -f\,\mathbf{k}\times\mathbf{u}\\[2pt] \mathbf{k}\times\mathbf{u} = (-v,\, u) \;&\Rightarrow\; \frac{du}{dt} = f\,v, \quad \frac{dv}{dt} = -f\,u \end{aligned}\]
\(f = 2\Omega\sin\varphi\): the Coriolis parameter, twice the local rotation rate
- \(u\) east, \(v\) north. Moving east (\(u>0\)): \(v\) decreases, it turns south; then \(u\) decreases: it keeps turning right
- The speed \(U = |\mathbf{u}|\) does not change: a circle of radius \(U/f\), once every \(2\pi/f\): 17 h at Milan (pendulum: 34 h)
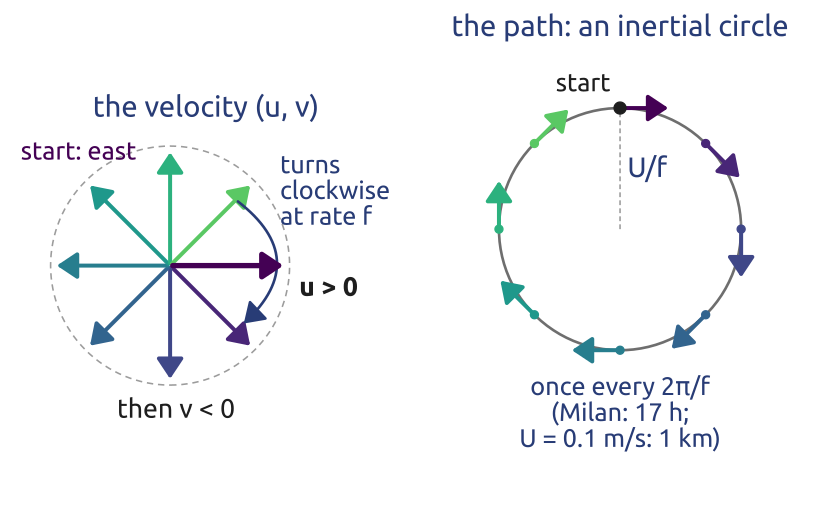
\(u\) feeds \(v\) and \(v\) feeds \(u\): moving water and air turn in circles, the inertial oscillations
(Cushman-Roisin and Beckers 2011, sec. 2.3; Persson 1998, 1377)
Ferrel (1856–58): wind along the isobars
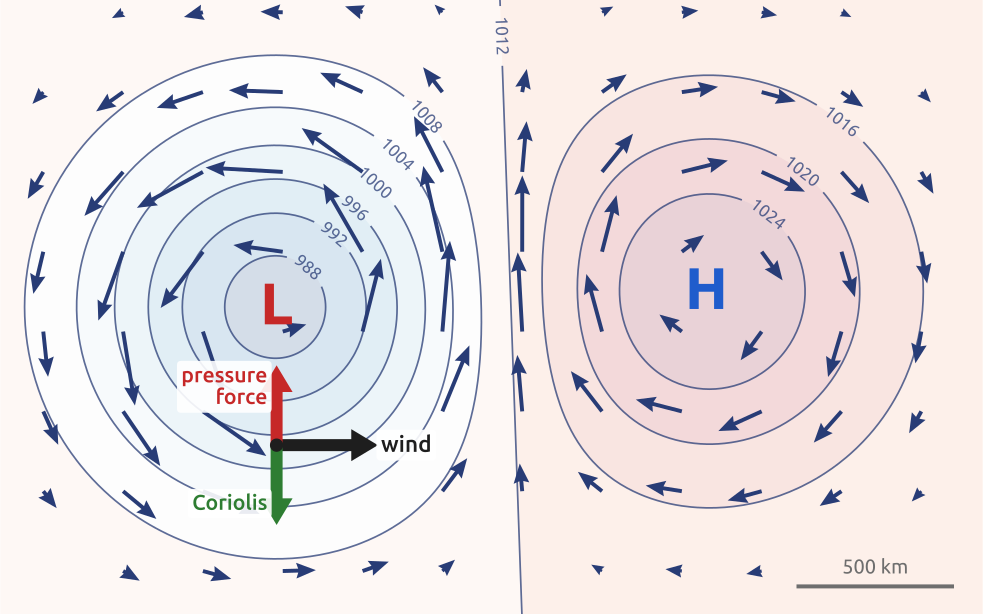
\[f\,\mathbf{k}\times\mathbf{u}_g = -\frac{1}{\rho}\nabla p \quad\Longleftrightarrow\quad \mathbf{u}_g = \frac{1}{\rho f}\,\mathbf{k}\times\nabla p\]
\(\mathbf{u}_g\): geostrophic wind; \(f = 2\Omega\sin\varphi\); \(\mathbf{k}\): vertical; \(p\), \(\rho\): pressure, density
The previous slide, plus the pressure force:
\[\begin{aligned} \frac{du}{dt} &= f\,v - \frac{1}{\rho}\frac{\partial p}{\partial x}, & \frac{dv}{dt} &= -f\,u - \frac{1}{\rho}\frac{\partial p}{\partial y}\\[4pt] u_g &= -\frac{1}{\rho f}\frac{\partial p}{\partial y}, & v_g &= \frac{1}{\rho f}\frac{\partial p}{\partial x} \end{aligned}\]
Second line: the forces balance: the geostrophic wind
- Not from high to low pressure: along the isobars, anticlockwise round a low (northern hemisphere)
- Buys Ballot’s law (1857), from weather maps: in the northern hemisphere, wind at your back, low pressure on your left
- But: a sea breeze blows from high to low. When does the rotation win?
Large, slow winds blow along the isobars: the pressure force and the Coriolis force balance
(Ferrel 1858; Persson 1998, 1376; Vallis 2017, sec. 2.8.2)
In class: does it feel the Earth’s rotation?
Exercise 2 — Does it feel the Earth’s rotation? For each phenomenon, estimate a typical speed \(U\) and size \(L\), then the Rossby number \(Ro = U/(fL)\), with \(f = 2\Omega\sin\varphi\) and \(\Omega \approx 7.29\times10^{-5}\,\mathrm{s^{-1}}\). Start with \(f\) at Milan (\(\varphi = 45.5^\circ\) N). Rotation matters when \(Ro \lesssim 1\).
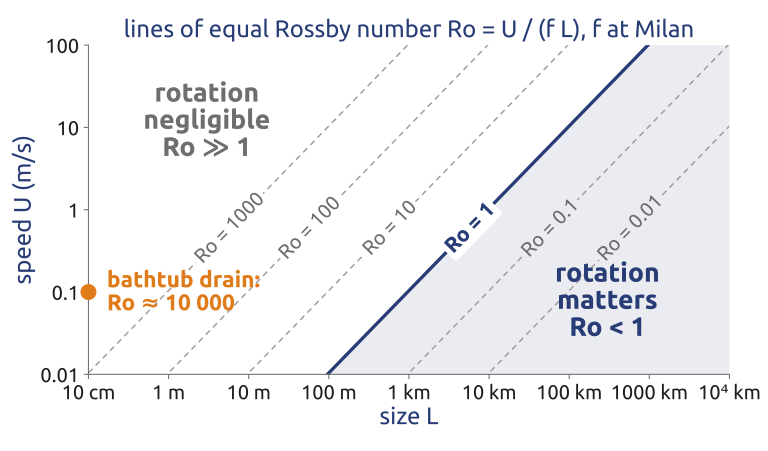
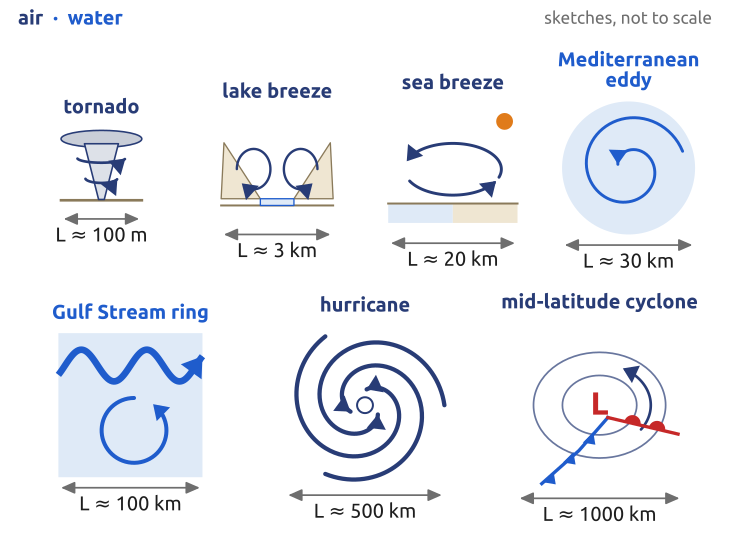
To hand in: nearer the equator. Redo it for a place of your choice between the equator and \(15^\circ\) (north or south). At what latitude does a mid-latitude cyclone (\(U = 10\) m/s, \(L = 1000\) km) reach \(Ro = 1\)?
In notebook 01 (exercise 2.1): open in Colab · download
(Vallis 2017, sec. 2.8.1; Cushman-Roisin and Beckers 2011, sec. 4.5)
Observing the ocean, 1769–1876
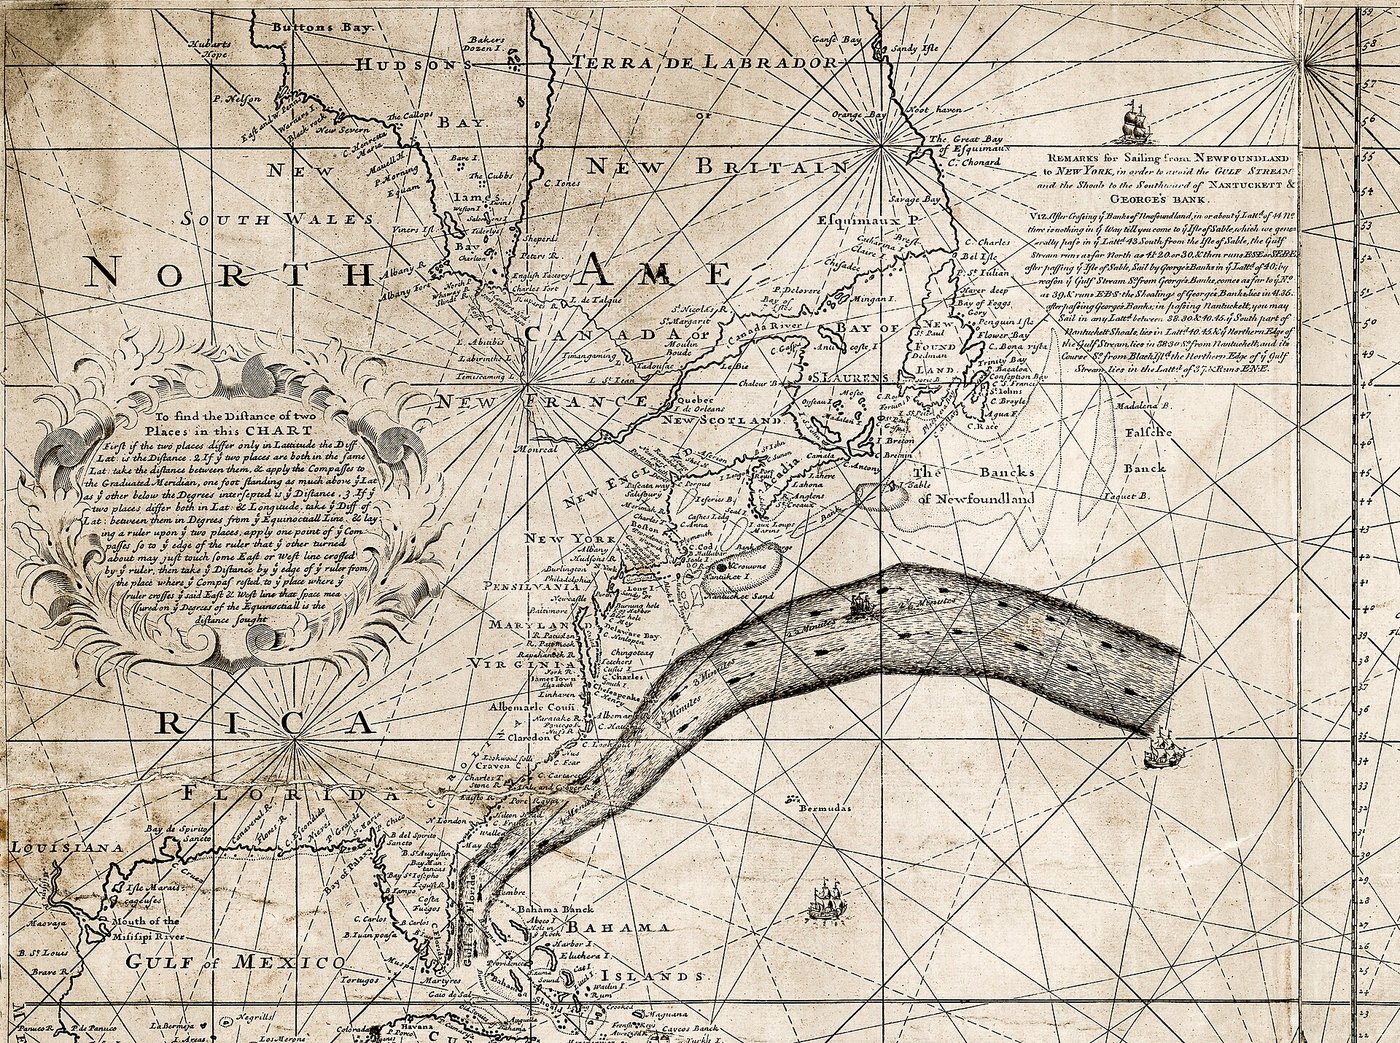
Franklin–Folger chart of the Gulf Stream, London, 1769. Library of Congress
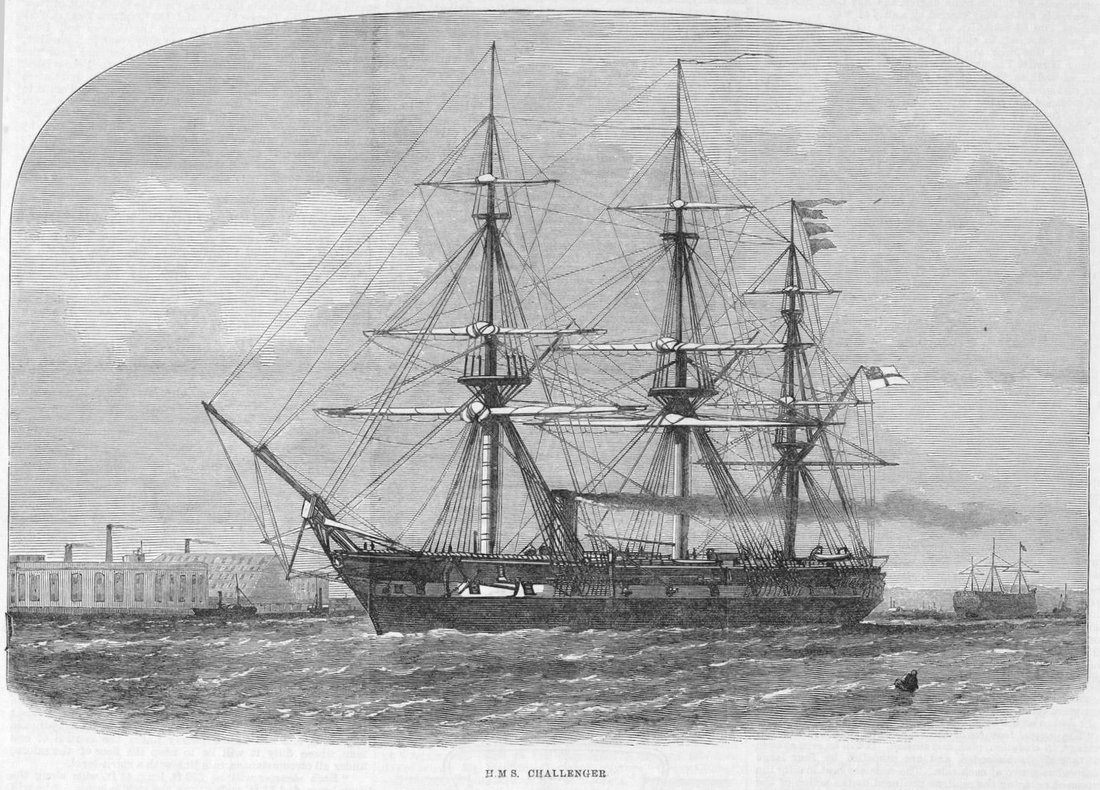
HMS Challenger. The Illustrated London News, 1872
- Franklin, postmaster: mail ships from England took two weeks longer than merchant ships. Captain Folger: they sailed against the Gulf Stream
- Maury (US Navy, 1847–1855): charts from ships’ logs
- Challenger (1872–1876): the first survey of the deep ocean
- But: what drives them: density differences or the wind?
Ships mapped the currents long before any theory could explain them


Kelvin (1869): circulation, the spin of a fluid
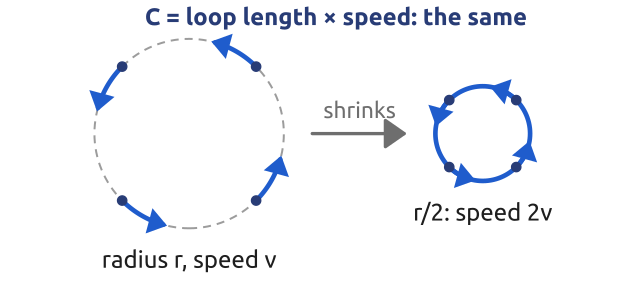
Kelvin (1869): with no friction, the circulation of a loop moving with the fluid is kept, at constant density and in any barotropic fluid (density set by pressure alone; Silberstein, 1896)
\[C = \oint \mathbf{u}\cdot d\mathbf{l}, \qquad \frac{DC}{Dt} = 0\]
\(C\): circulation (spin) of a loop; \(d\mathbf{l}\): piece of the loop
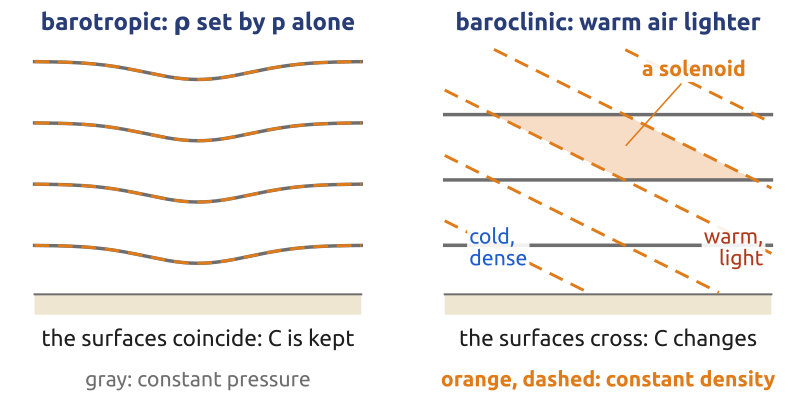
But: in a barotropic fluid at rest, nothing ever starts to turn. How do winds and currents start?
Without friction, in a barotropic fluid, spin is kept: a shrinking loop spins faster
(Thomson 1869; Thorpe et al. 2003)
Bjerknes (1898): how winds and currents start
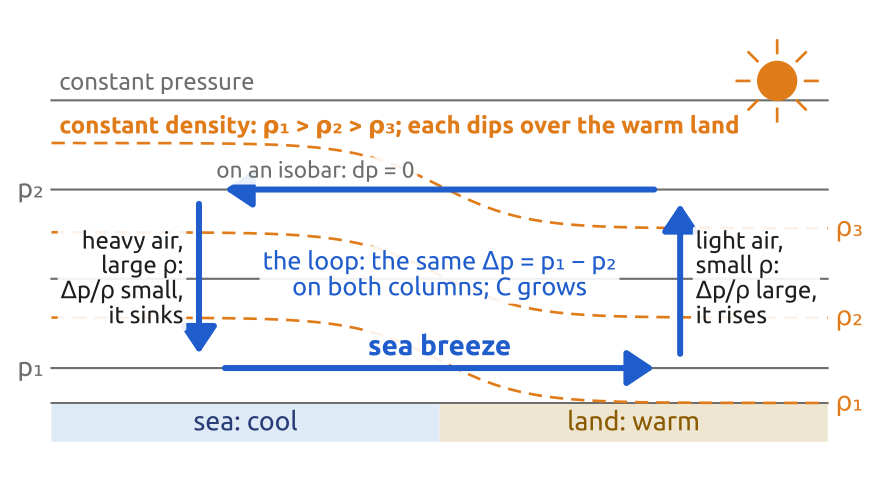
Silberstein (1896) found it first: a fluid at rest starts to turn if, and only if, its surfaces of constant pressure and density cross (baroclinic). Bjerknes applied it to air and sea.
- The Sun warms the land more than the sea: at the same pressure, warm air is lighter
- Both columns span the same \(\Delta p = p_1 - p_2\); per kilogram the push is \(\Delta p/\rho\): larger for the light air
- The light air rises, the heavy air sinks: a breeze from the sea
\[\begin{aligned}\frac{DC}{Dt} &= -\oint\frac{dp}{\rho}\\ &= \Delta p\left(\frac{1}{\rho_{\mathrm{land}}} - \frac{1}{\rho_{\mathrm{sea}}}\right) > 0\end{aligned}\]
\(C\): circulation around the loop; \(p\): pressure; \(\rho\): density; \(\Delta p = p_1 - p_2\)
Uneven heating makes density differences, and density differences make winds and currents
(Bjerknes 1898; Thorpe et al. 2003; Vallis 2017, sec. 4.3)
Teisserenc de Bort, Assmann (1902): layers
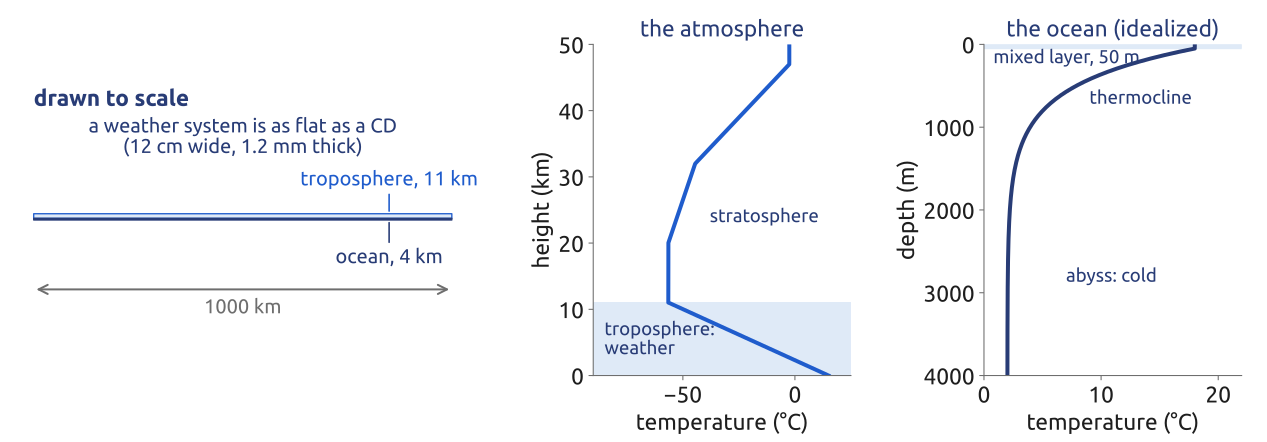
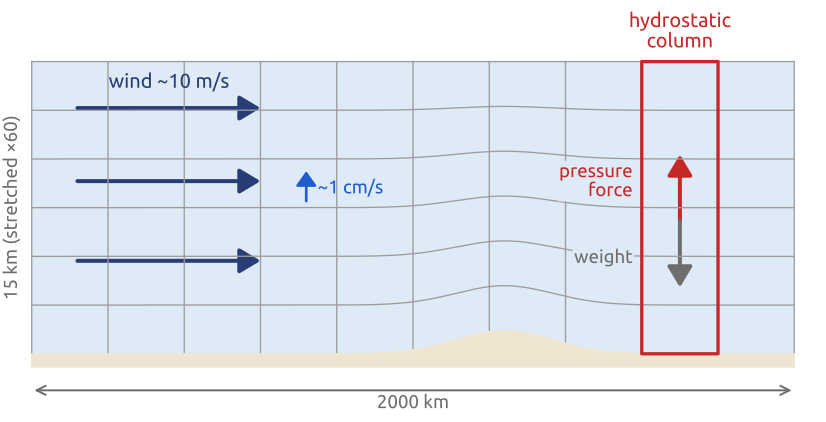
Thin: 10 km of air, 4 km of water, systems 1000 km wide: motions are mostly horizontal
Layered: with balloons, Teisserenc de Bort and Assmann (1902) found that the air stops cooling above ~11 km: the troposphere under the stratosphere. Ocean: warm water over a cold abyss
Hydrostatic balance: in each column, the pressure is the weight above.
The atmosphere and the ocean are thin, layered, nearly hydrostatic shells on a rotating sphere
(Vallis 2017, sec. 2.7 and Ch. 15, endnote 7 (p. 583); Cushman-Roisin and Beckers 2011, sec. 4.3)
Bjerknes (1904): an initial-value problem
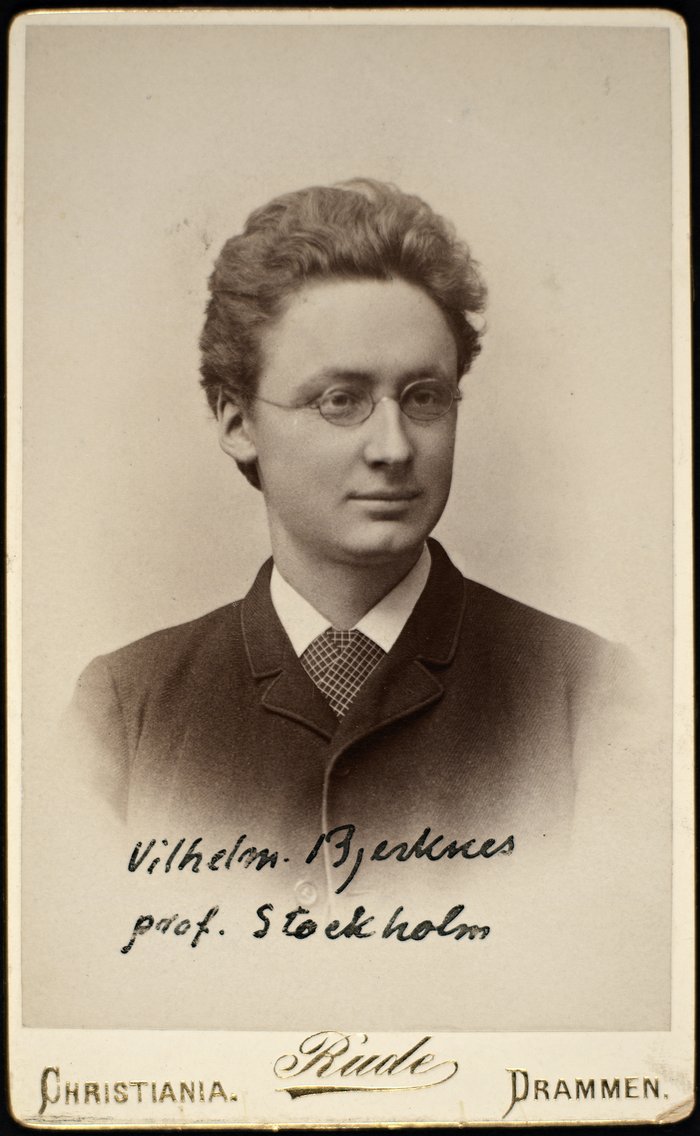
Vilhelm Bjerknes (1862–1951). Nasjonalbiblioteket, CC BY 2.0
A rational forecast needs: “1. […] the state of the atmosphere at a given time. 2. […] the laws according to which one state of the atmosphere develops from another.”
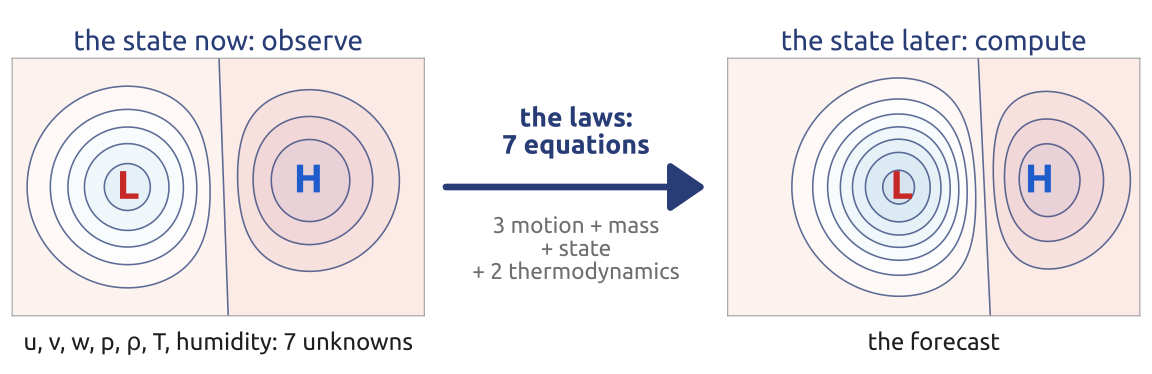
But: “There can be no question of a strictly analytical integration”: no formula solves the equations (not even three bodies under gravity). Bjerknes: step the maps forward hour by hour, graphically.
A forecast is an initial-value problem: observe the state now, integrate the laws forward
(Bjerknes 1904; Lynch 2008b) · Photo: commons.wikimedia.org: Portrett av Vilhelm Bjerknes

Ekman (1905): the wind-driven ocean
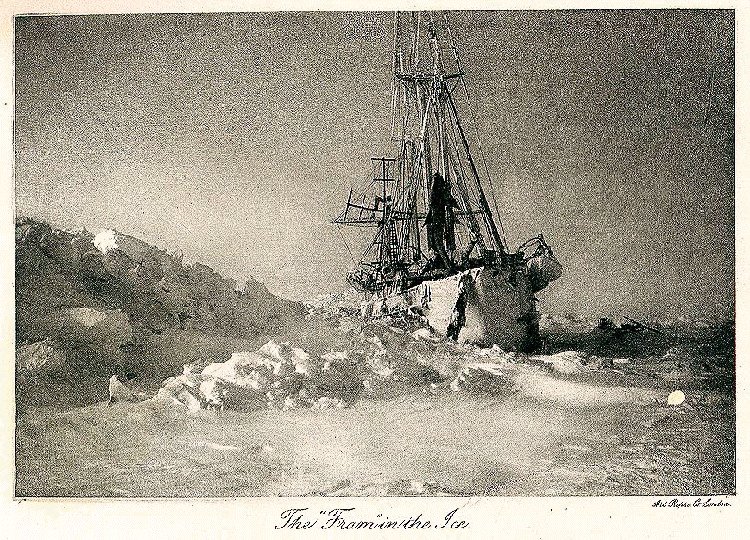
The Fram. Nansen (1897), Farthest North
Nansen (Fram, Arctic, 1893–96): the ice drifted 20–40° right of the wind
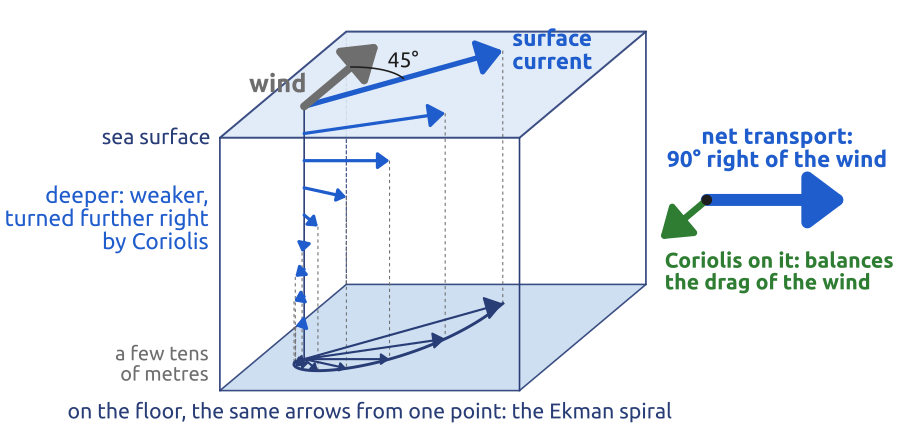
Ekman (1905): the layer moves \(90^\circ\) right of the wind (northern hemisphere). The ice moves with the surface water: \(45^\circ\) in Ekman’s model, less with real mixing: Nansen’s 20–40°
But: why is the Gulf Stream narrow, fast, and off America, not Europe?
\[\mathbf{M}_E = \frac{\boldsymbol{\tau}\times\mathbf{k}}{\rho_0 f}\]
\(\mathbf{M}_E\): volume transport per unit width (m²/s); \(\boldsymbol{\tau}\): wind stress; \(\rho_0\): water density; \(f = 2\Omega\sin\varphi\); \(\mathbf{k}\): vertical
Coriolis balances the drag of the wind: the wind-driven layer moves at right angles to the wind
(Ekman 1905; Stewart 2008, sec. 9.2; Munk 2002, 136) · Photo: commons.wikimedia.org: FMIB 32687 The Fram in the Ice

Richardson (1922): the laws, by numbers
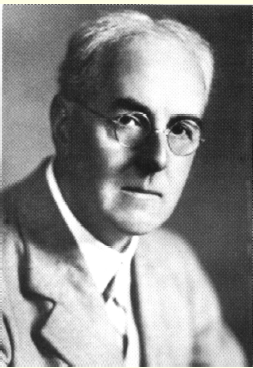
Lewis Fry Richardson (1881–1953). NOAA, public domain
\[\begin{aligned} &\text{momentum:} && \frac{D\mathbf{u}_h}{Dt} + f\,\mathbf{k}\times\mathbf{u}_h = -\frac{1}{\rho}\nabla_h p + \mathbf{F}\\[2pt] &\text{hydrostatic balance:} && \frac{\partial p}{\partial z} = -\rho g\\[2pt] &\text{continuity:} && \frac{D\rho}{Dt} + \rho\,\nabla\cdot\mathbf{u} = 0\\[2pt] &\text{first law, ideal gas:} && c_p\frac{DT}{Dt} - \frac{1}{\rho}\frac{Dp}{Dt} = Q, \qquad p = \rho R T \end{aligned}\]
\(\mathbf{u}_h\), \(\nabla_h\): horizontal wind and gradient; \(f = 2\Omega\sin\varphi\); \(\mathbf{F}\): friction; \(p\), \(\rho\), \(T\): pressure, density, temperature; \(Q\): heating; \(R\), \(c_p\): gas constant, specific heat
Bjerknes’ laws on a chequerboard of squares about 200 km wide: derivatives become finite differences, stepped forward in time
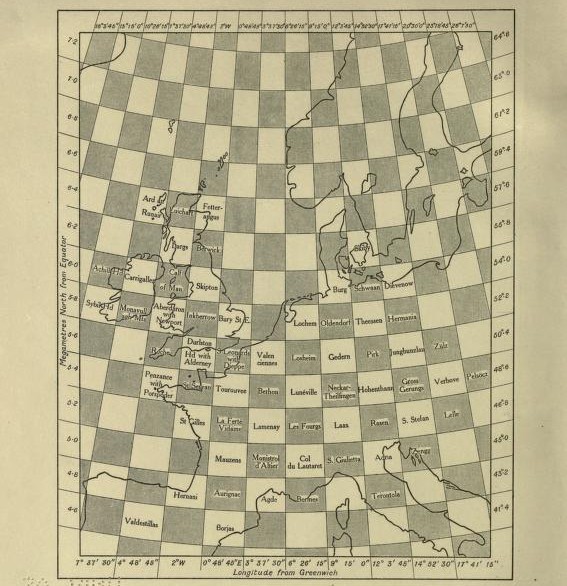
Richardson (1922), frontispiece: pressure and wind in alternate squares. Public domain
By hand: a forecast six hours ahead, computed on paper: about six weeks of computing, spread over some two years, while he drove an ambulance in France in the war
The first forecast by numbers: the laws on a grid, stepped forward in time
(Richardson 1922, 219; Lynch 1999, 61–68; Hunt 1998) · Portrait: commons.wikimedia.org: Lewis_Fry_Richardson.png · Grid: archive.org/details/weatherpredictio00richrich

Richardson’s dream: the forecast factory
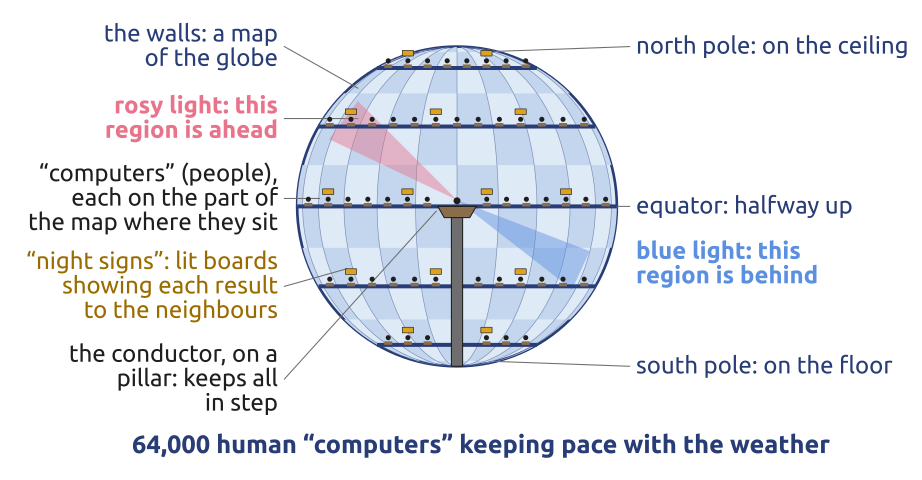
Sketch from Richardson’s own description (1922, p. 219) · ▶ the painting by Stephen Conlin (1986), online
The result: surface pressure rising 145 hPa in 6 hours; “observations show that the barometer was nearly steady”
Why: winds and pressures slightly out of balance set off fast gravity waves, which swamped the slow weather
The dream: 64,000 people in a hall, each computing one region, a conductor keeping them in step: “Perhaps some day in the dim future it will be possible to advance the computations faster than the weather advances […] But that is a dream.”
What he left: observe the state, put it on a grid, step the laws forward, faster than the weather
It failed badly, but it left the method of every operational forecast since
(Richardson 1922, vii, 187, 219; Lynch 2008b, secs. 1.2–1.3) · The factory: emetsoc.org: Richardson’s Fantastic Forecast Factory
Rossby (1939): waves in the mid-latitude winds
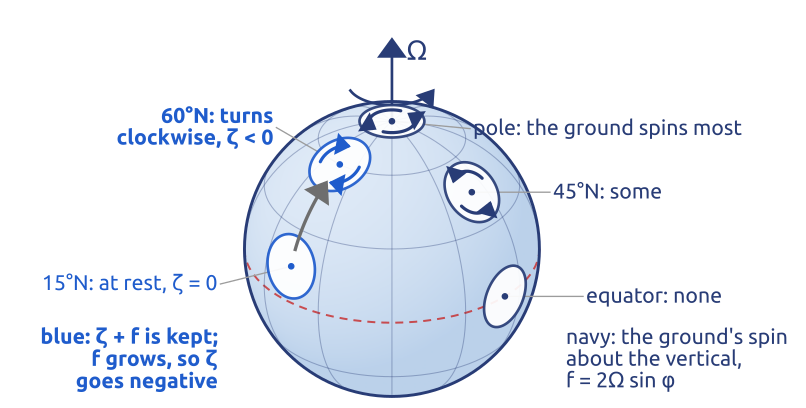
Vorticity \(\zeta = \partial_x v - \partial_y u\): the spin of a small column relative to the ground. A column keeps its total spin \(\zeta + f\): carried north, \(f\) grows, so \(\zeta < 0\): it turns clockwise seen from above. \(f\) grows northward in both hemispheres: the waves drift west in both
A catch: the wind carries them: cyclones still travel east
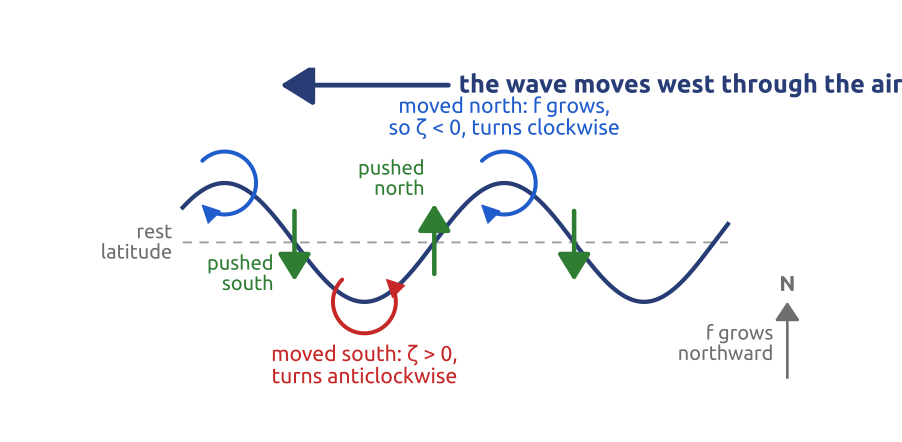
\[\frac{D}{Dt}(\zeta + f) = 0 \qquad \beta = \frac{df}{dy} > 0\] \[\underbrace{c}_{\substack{\text{wave speed}\\ \text{relative to the ground}}} = \underbrace{U}_{\text{wind}} - \underbrace{\frac{\beta}{k^2}}_{\substack{\text{drift west}\\ \text{through the air; } k = 2\pi/L}}\]
Because \(f\) grows to the north, the waves drift west, against the wind that carries them
(Rossby and collaborators 1939; Vallis 2016)
Rossby waves on the jet: August 2002
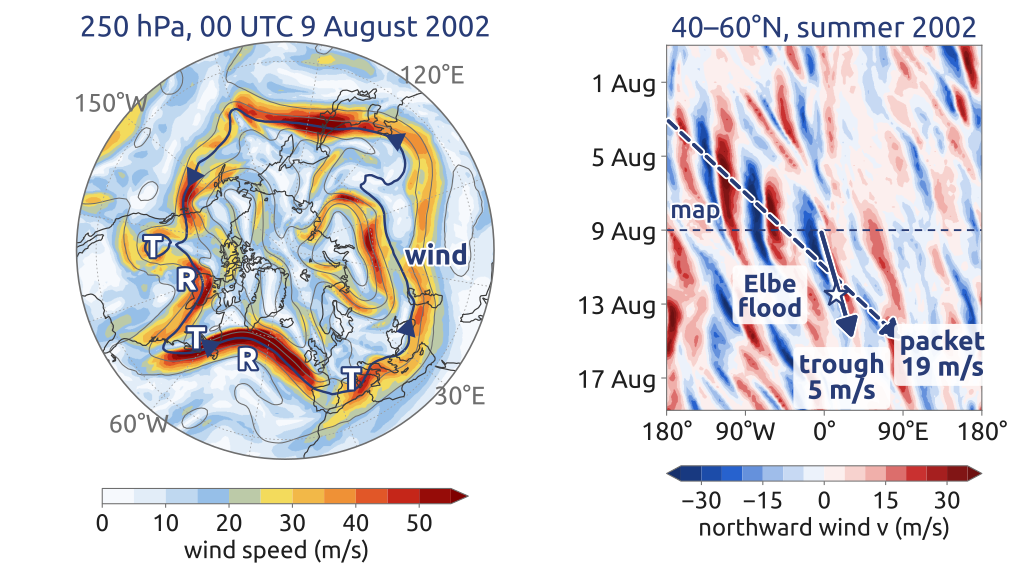
Left: 250 hPa, 00 UTC 9 Aug 2002; colours: wind speed; lines: geopotential height every 120 m (navy: 10,680 m). Right: northward wind \(v\) at 250 hPa, 40–60°N mean, every 6 h, longitude against time (a Hovmöller diagram); arrows: a trough, the packet; star: Elbe flood
ERA5 (Hersbach et al. 2020); contains modified Copernicus Climate Change Service information [2026]
Troughs (T) and ridges (R): the jet meanders around the hemisphere; the wind along it steers the cyclones. Right: air going north (red), south (blue)
Each trough moves east, about 5 m/s, slower than the wind (16 m/s): relative to the air it drifts west, 16 − 5 ≈ 11 m/s, Rossby’s \(\beta/k^2\)
The packet of large waves runs east faster, 19 m/s: from the Pacific (3 Aug) to Europe, where it came with the low whose rain flooded the Elbe (12–13 Aug)
On the jet, troughs crawl east, slower than the wind; the wave packet runs ahead
(Wirth et al. 2018, 1966–72; Hovmöller 1949; Ulbrich et al. 2003, 371) · Data: cds.climate.copernicus.eu: ERA5 hourly data on pressure levels
Blocks: when a Rossby wave stands still
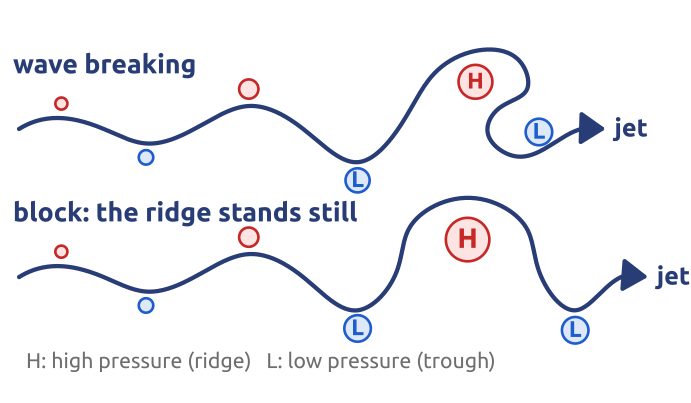
A Rossby wave on the jet can grow until it breaks (the crest overturns) or blocks: a large ridge stands still, a low on each side (an omega), and the jet goes around it
\[c = U - \frac{\beta}{k^2} = 0 \;\Longrightarrow\; L_s = 2\pi\sqrt{\frac{U}{\beta}}\]
\(c\): wave speed over the ground; \(U\): eastward wind; \(\beta = df/dy\); \(k = 2\pi/L\); \(L_s\): the wavelength that stands still
With \(U \approx 10\) m/s at 50°N: \(L_s \approx 5000\) km, the size of a block
Long Rossby waves can stand still against the wind: a large ridge that stalls is a block
(Holton 2004, sec. 7.7.1; Woollings et al. 2018)
Blocking over Europe: summer 2026
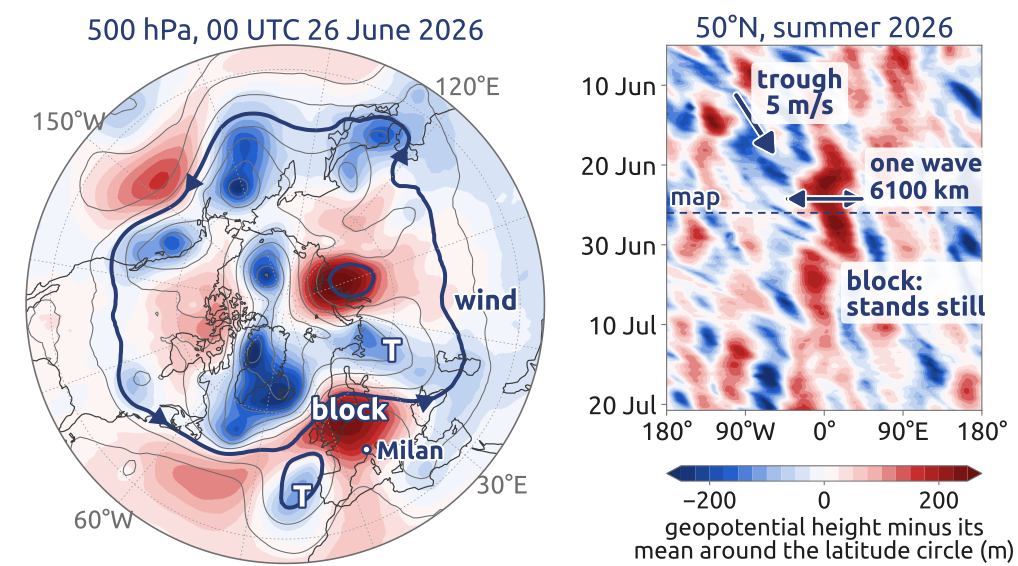
Left: 500 hPa, 00 UTC 26 June 2026; colours: geopotential height minus its latitude-circle mean (m); lines: geopotential height every 80 m (navy: 5760 m). Right: same colours at 50°N, every 6 h, longitude against time; arrows: a trough; one wave, trough to trough
ERA5 (Hersbach et al. 2020); contains modified Copernicus Climate Change Service information [2026]
June–July 2026: a ridge stood still over western Europe for three weeks (17 June–9 July), an omega between two troughs: a block; under it, western Europe’s warmest June–July on record
\[c = U - \frac{\beta}{k^2} = 0 \;\Longrightarrow\; L_s = 2\pi\sqrt{\frac{U}{\beta}} \approx 4800\ \text{km}\] \(c\): wave speed over the ground; \(U \approx 8.5\) m/s: mean eastward wind (500 hPa, 50°N, 17 June–9 July); \(\beta = df/dy = 1.5\times10^{-11}\) m\(^{-1}\)s\(^{-1}\); \(k = 2\pi/L\)
The block’s wave, about 6100 km, is about the size of \(L_s\): waves this long can stand still against the wind
But: why a block lasts for weeks, linear waves do not tell; there is no complete theory of blocking
Summer 2026: a block, a long Rossby wave standing still over western Europe for weeks
(Holton 2004, sec. 7.7.1; Woollings et al. 2018; Copernicus Climate Change Service 2026) · Data: cds.climate.copernicus.eu: ERA5 hourly data on pressure levels
Charney (1948): keep the slow waves only
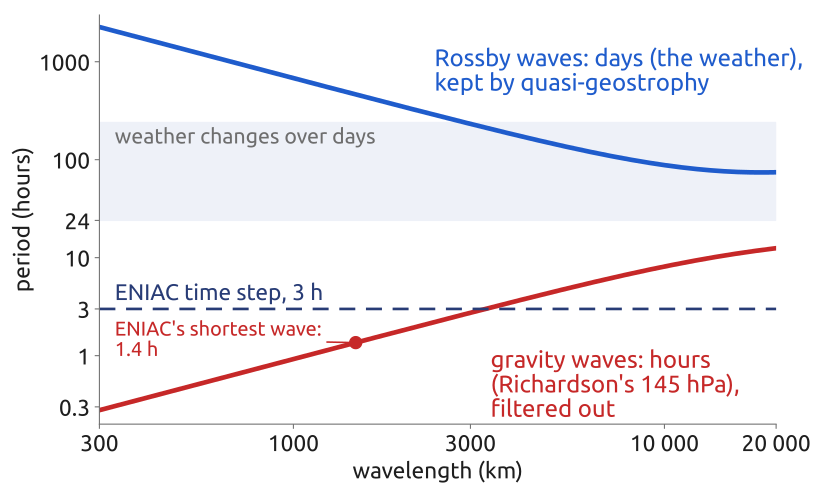
Waves in one layer of air at 45°N, no wind: period against wavelength
- The same equations carry gravity waves (hours) and Rossby waves (days); the weather is the slow kind
- Charney: with the wind nearly geostrophic and the air hydrostatic, the quasi-geostrophic equations keep only the Rossby waves
\[\underbrace{\frac{D}{Dt}\Big(\zeta + f - \frac{\psi}{L_d^2}\Big) = 0}_{\text{quasi-geostrophic, one layer}}\] \[\Big\downarrow \;\; \text{no divergence (scales} \ll L_d\text{)}\] \[\underbrace{\frac{D}{Dt}(\zeta + f) = 0}_{\text{Rossby's barotropic vorticity equation}}\]
\(\psi\): streamfunction, \(\zeta = \nabla^2\psi\); \(L_d = c/f\): deformation radius (\(c\): gravity-wave speed), about 3000 km
But: a million multiplications: a machine?
Scale analysis: drop what is small at large scales, and the fast waves go away
(Charney 1948; Lynch 2008b, sec. 2.2; Charney et al. 1950, 245)
The first computer forecast (1950)
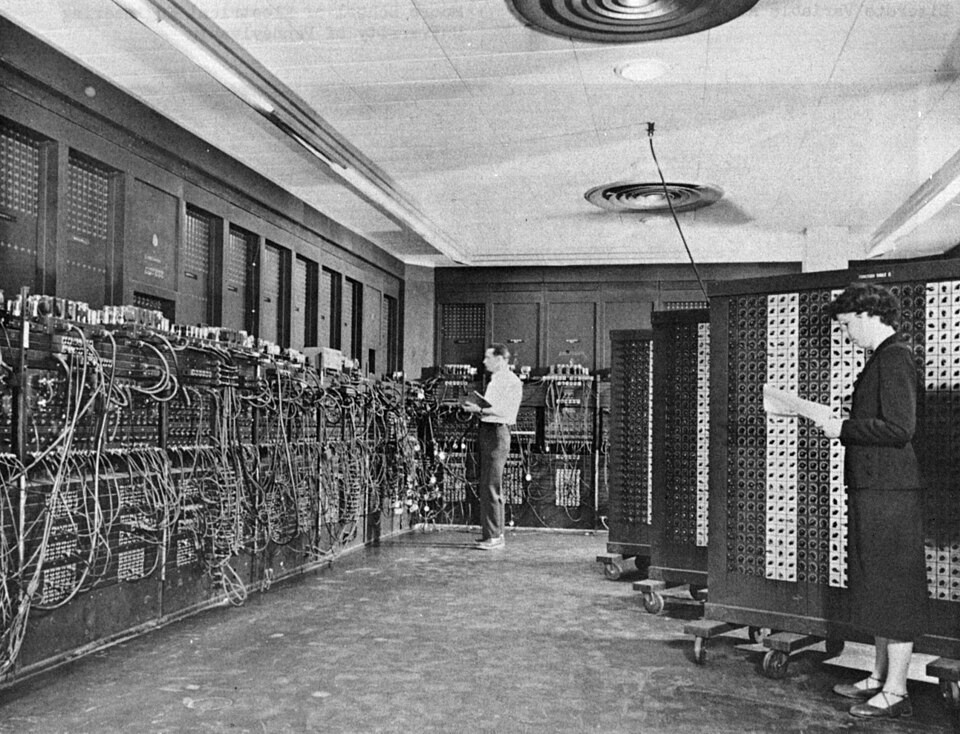
The ENIAC at Aberdeen, programmed by Glen Beck and Betty Snyder. U.S. Army photo, public domain
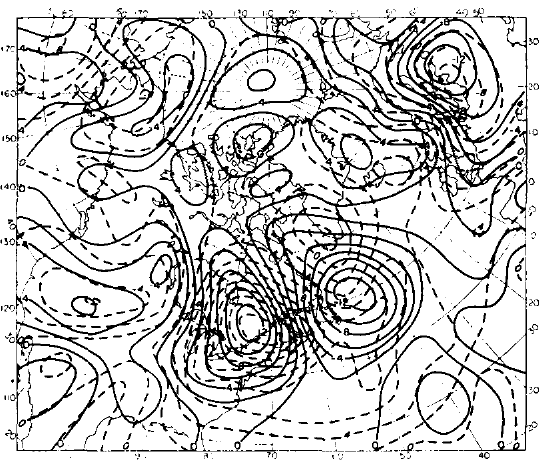
24-h change of 500 hPa geopotential height, 30 Jan. 1949: observed (solid), computed (dashed). CC BY 4.0
Charney, Fjørtoft and von Neumann: Rossby’s barotropic vorticity equation for the 500 hPa level, 736 km grid, 3-hour steps; 24 hours of computing for a 24-hour forecast
\[\frac{\partial\zeta}{\partial t} + J(\psi, \zeta + f) = 0\] \[\zeta = \nabla^2\psi: \text{ each step solves for the wind}\]
\(\zeta\): vorticity; \(J(\psi, q)\): advection of \(q\) by the wind; \(f\): Coriolis parameter; \(\psi\): streamfunction, \(u = -\partial_y\psi\), \(v = \partial_x\psi\)
Princeton, 1946: after the war, von Neumann (on the atomic bomb at Los Alamos from 1943) chose weather for his new computer: a Navy-funded Meteorology Project, wartime-trained scientists, Charney leading from 1948
1950: the first forecast by numbers that worked, with one equation for one layer of air
(Charney et al. 1950; Lynch 2008a; Thompson 1983; Lewis 2021) · Photo: commons.wikimedia.org: ENIAC · Map: doi:10.3402/tellusa.v2i4.8607, Fig. 3c

Sverdrup, Stommel, Munk: the wind-driven gyres
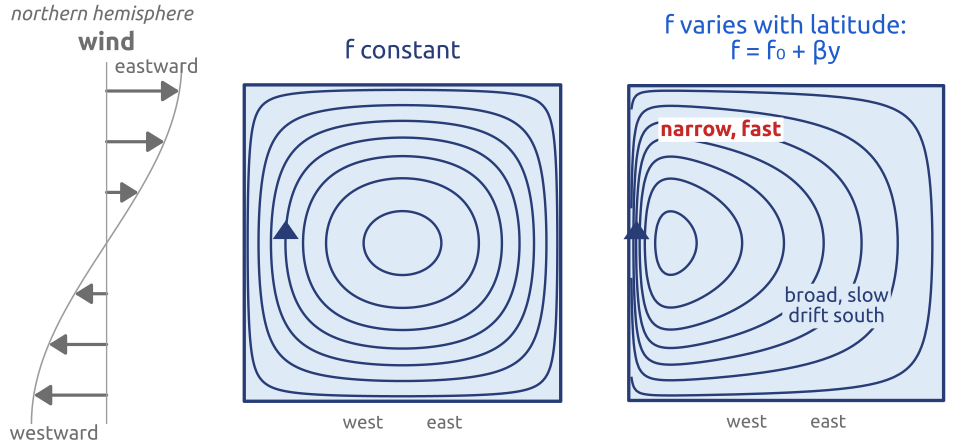
Sverdrup (1947): the wind’s spin, against \(\beta = df/dy\) (how fast \(f\) grows to the north), sets the slow drift of the interior
\[\beta V = \frac{\mathbf{k}\cdot\nabla\times\boldsymbol{\tau}}{\rho_0}\]
\(V\): northward transport; \(\boldsymbol{\tau}\): wind stress; \(\rho_0\): density of sea water; \(\mathbf{k}\cdot\nabla\times\): spin (curl)
Stommel (1948): with \(\beta\), the return flow is narrow and fast, along the ocean’s western side, off America: the Gulf Stream. Munk (1950): real winds, real transports
The same \(\beta\): the weather’s waves drift west, the Gulf Stream hugs the ocean’s western side
(Sverdrup 1947; Stommel 1948; Munk 1950; Vallis 2017, sec. 19.1)
Bryan, Cox (1960s): the ocean by numbers
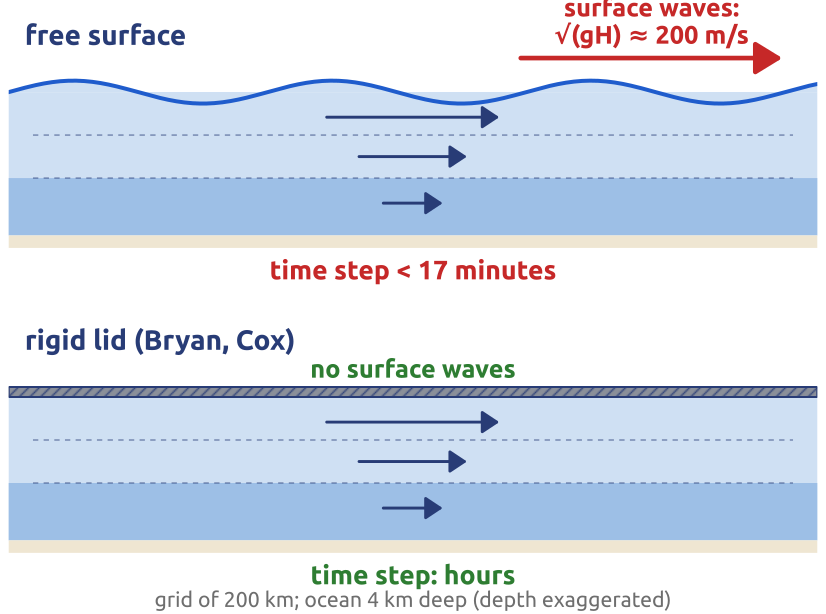
- 1960: GFDL starts a model of the world ocean (Kirk Bryan, Michael Cox): “a fool’s mission” for many
- The trick: a rigid lid removes the fast surface waves, so the step can be long, as Charney’s filter did for the air
- Manabe and Bryan (1969): ocean and atmosphere coupled: the first climate model
\[\begin{aligned} &\text{momentum:} && \frac{D\mathbf{u}_h}{Dt} + f\,\mathbf{k}\times\mathbf{u}_h = -\frac{1}{\rho_0}\nabla_h p + \mathbf{F}\\[2pt] &\text{hydrostatic balance:} && \frac{\partial p}{\partial z} = -\rho g\\[2pt] &\text{continuity (Boussinesq):} && \nabla\cdot\mathbf{u} = 0, \qquad \text{rigid lid: } w = 0 \text{ at the top}\\[2pt] &\text{heat, salt, state:} && \frac{DT}{Dt} = \dot T, \quad \frac{DS}{Dt} = \dot S, \quad \rho = \rho(T, S, p) \end{aligned}\]
\(\mathbf{u}_h\): horizontal current; \(\rho_0\): mean density of seawater; \(\mathbf{F}\): friction; \(T\): temperature; \(S\): salinity; \(\dot T\), \(\dot S\): sources by turbulent mixing, not time derivatives (surface fluxes: boundary conditions)
The ocean followed the air: first models in the 1960s, with the fast waves filtered out
(Bryan 1969, 349–51; Randall et al. 2019, sec. 4a; Manabe and Bryan 1969)
Timeline: to weather and ocean models
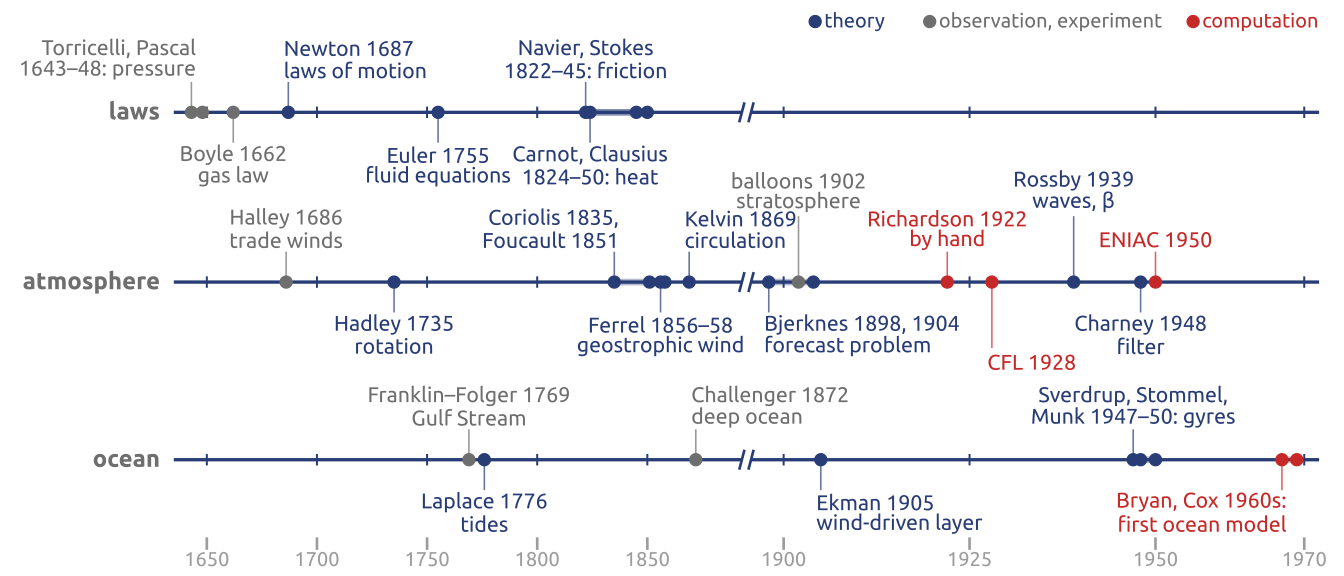
By the 1960s: the physics, and the first computed atmosphere and ocean, the roots of today’s models
(Vallis 2016; Lynch 2008b)
A weather model today
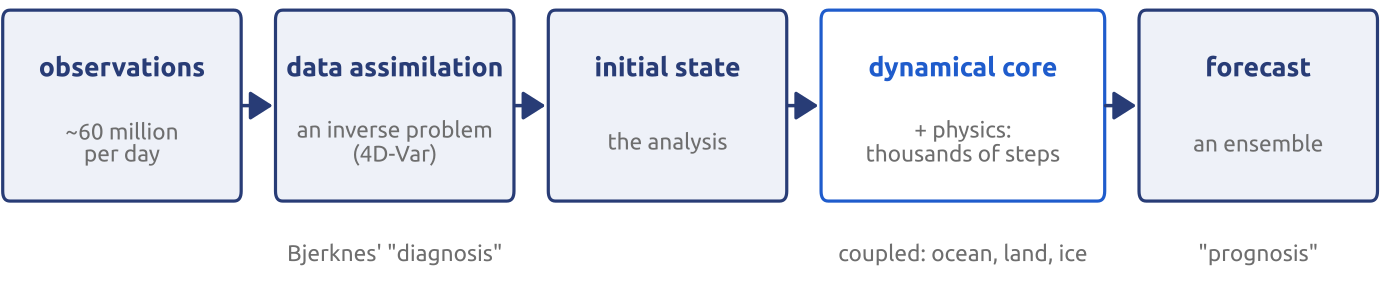
- 1950: one equation, one layer of air, a 736 km grid over North America; a day of computing for a day of forecast
- Today: the full equations on the whole globe, ~10 km, ~100 levels, coupled to ocean, land and ice; observations assimilated; ensembles; minutes of computing
Bjerknes’ plan, Richardson’s method; inside the dynamical core, the giants’ laws
(Bauer et al. 2015; Kalnay 2003; Lynch 2008b, secs. 1.2–1.3)
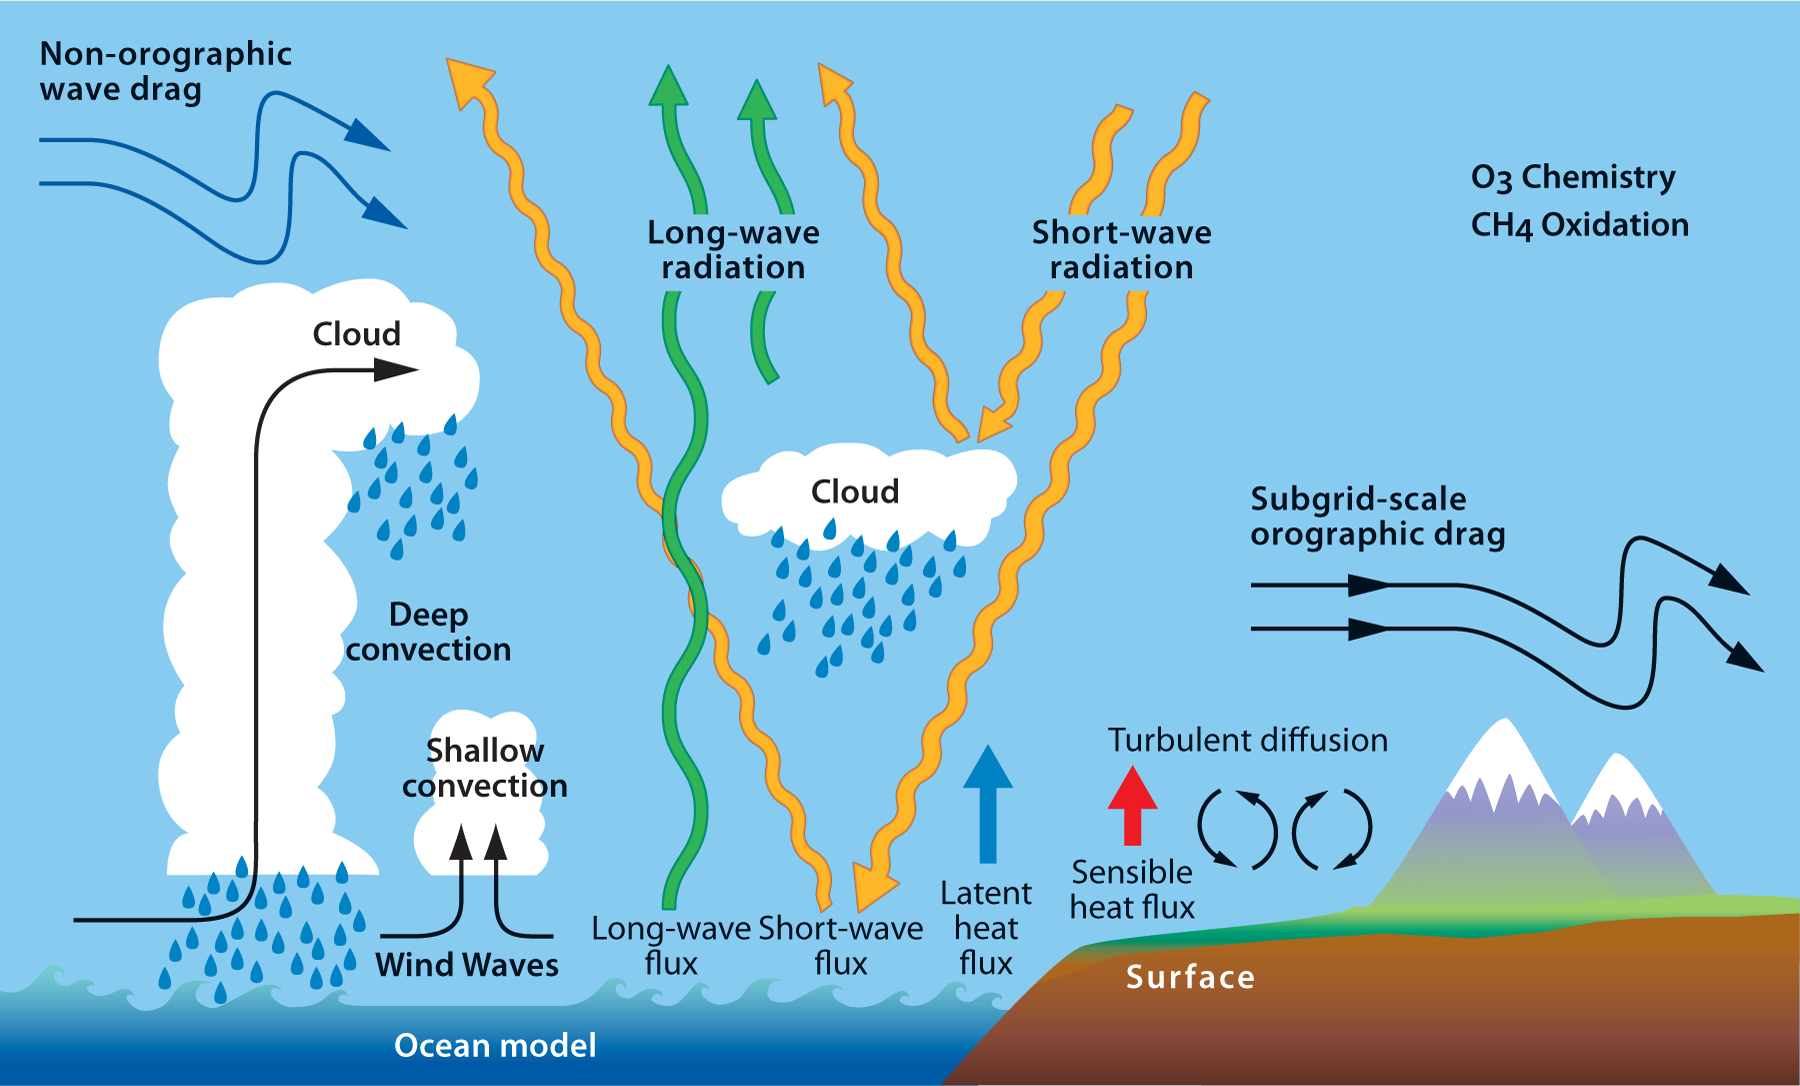
Operational weather forecast model
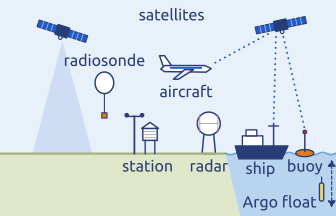
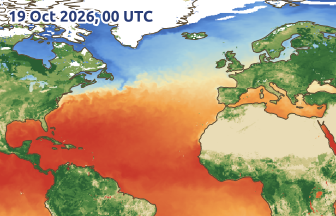
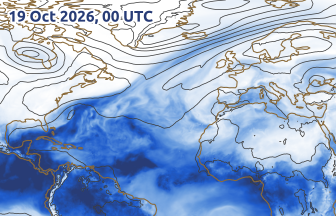
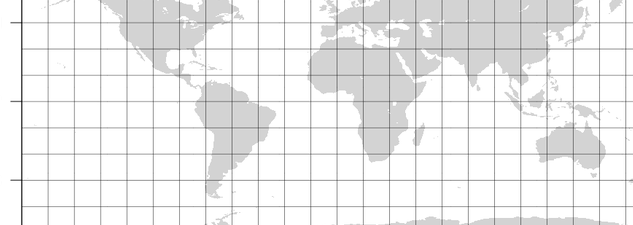




Data
Physics
Parameterization
Forcings
ocean, land, ice
Initial Conditions
Dynamical core
(Euler/Navier–Stokes)
Forecast
ECMWF, CC BY 4.0
At the start: sea-surface (skin) temperature, −2 (blue) to 30 °C (red); topsoil water, dry (sand) to wet (green); sea ice and snow, white
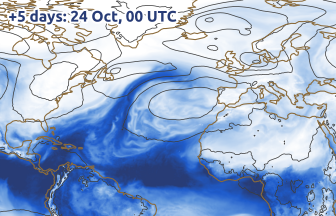
Initial conditions and forecast: total column water vapour, 5 (white) to 60 kg m⁻² (navy); lines: mean sea-level pressure every 8 hPa. All three maps: one run of the ECMWF IFS, 19 Oct 2026, 00 UTC (step 0 and +120 h), North Atlantic and Europe; drawn from ECMWF open data, CC BY 4.0
(Kalnay 2003) · Data: after wmo.int: Global Observing System · Physics: ecmwf.int: Atmospheric physics · Maps: ecmwf.int: Open data
A preview: the primitive equations
\[\frac{D\mathbf{u}_h}{Dt} + f\,\mathbf{k}\times\mathbf{u}_h = -\frac{1}{\rho}\nabla_h p + \mathbf{F}\] \[\underbrace{\frac{\partial p}{\partial z} = -\rho g}_{\text{hydrostatic balance}}\]
\(\mathbf{F}\): friction; \(p\): pressure; \(\rho\): density; \(g\): gravity; \(\nabla_h\): horizontal gradient
- Thin shell: the vertical equation becomes hydrostatic balance; rotation enters through \(f\); \(\mathbf{u}_h = (u, v)\) is the horizontal wind
- With mass, heat and the gas law: the primitive equations
- Richardson solved them by hand (1922); most climate models, and ocean models (with Boussinesq), still solve them
Thin and hydrostatic: the primitive equations, the core of weather, ocean and climate models
(Vallis 2017; Richardson 1922)