November 2026 · Politecnico di Milano
Modern weather, ocean and climate models
Atmosphere and Ocean Dynamics — Lecture 9
Prof. Dr. Pedro da Silva Peixoto
Applied Mathematics
Instituto de Matemática e Estatística
Universidade de São Paulo
Visiting Professor at MOX Lab
Politecnico di Milano
1950: one equation, one layer
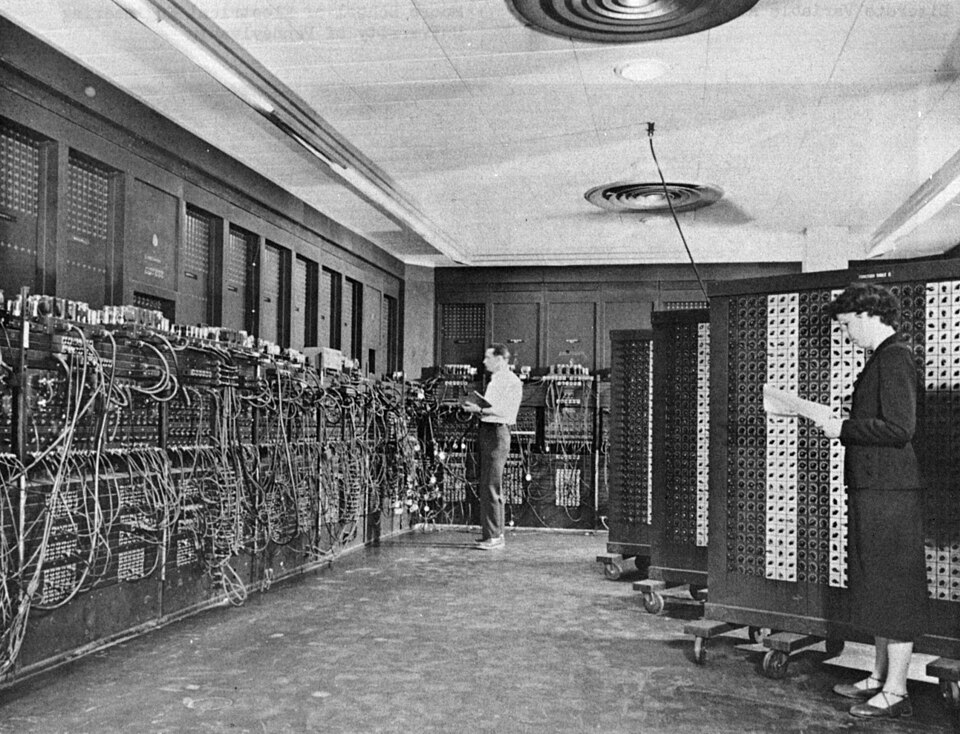
The ENIAC at Aberdeen. U.S. Army photo, public domain
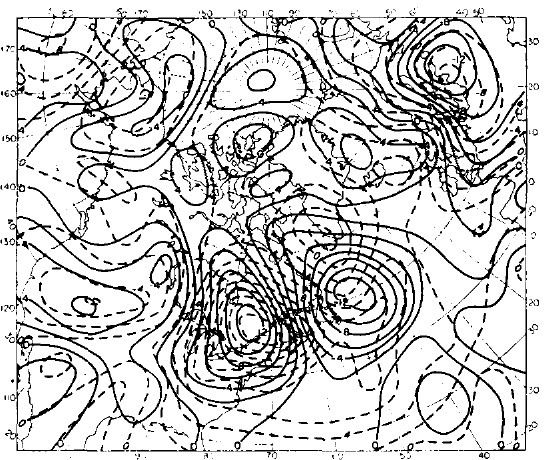
24-h change of 500 hPa height, 30 Jan. 1949: observed (solid), computed (dashed). CC BY 4.0
\[\frac{\partial\zeta}{\partial t} + J(\psi, \zeta + f) = 0, \qquad \nabla^2\psi = \zeta\]
\(\zeta\): vorticity; \(\psi\): streamfunction; \(J(\psi, q)\): advection of \(q\); \(f\): Coriolis parameter
- Charney, Fjørtoft and von Neumann: finite differences on a 736 km grid, 3-hour steps; 24 hours of computing for a 24-hour forecast
- No gravity waves, so the initial state needed no balancing
But: one level of one variable. How do we get the whole atmosphere?
The first forecast by numbers that worked: one equation, one layer, a Poisson problem at every step
(Charney et al. 1950; Lynch 2008) · Photo: commons.wikimedia.org: ENIAC · Map: doi:10.3402/tellusa.v2i4.8607, Fig. 3c

1950–1975: towards the general circulation
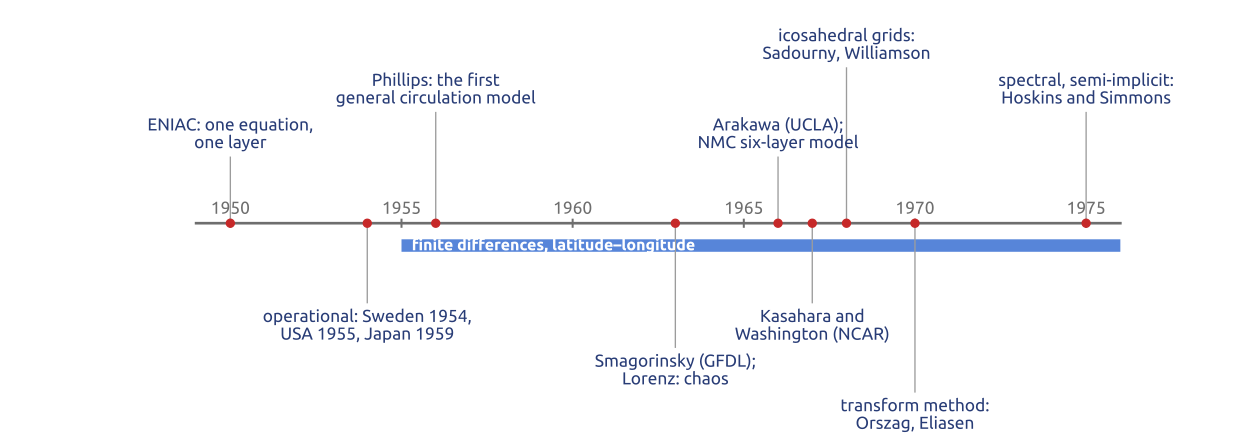
- Operational barotropic forecasts: Sweden 1954, the USA 1955, Japan 1959
- Phillips (1956): two levels, a month of the general circulation: the first climate model
- The 1960s: the primitive equations come back, with better initial states: GFDL, UCLA, NCAR; at NMC operational from 1966
- All on latitude–longitude grids, with finite differences
In twenty years, from one equation for one layer to general circulation models
(Phillips 1956; SMAGORINSKY 1963; KASAHARA and WASHINGTON 1967; Shuman and Hovermale 1968; Randall et al. 2019)
1963: Lorenz and the limits of prediction
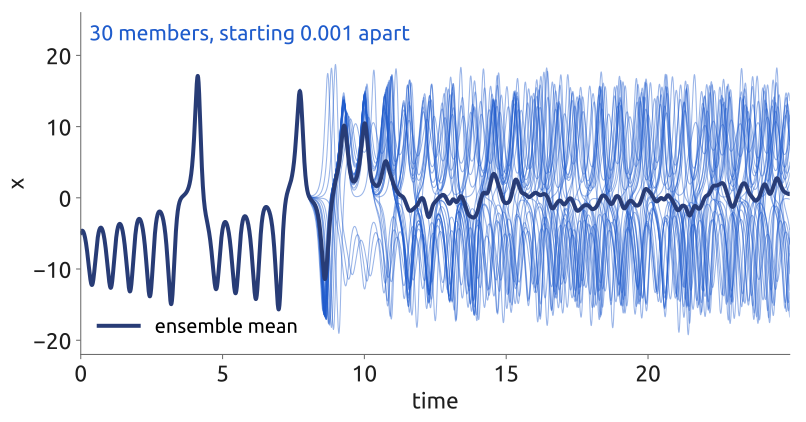
- Lorenz (1963): in a chaotic system, tiny differences grow until two forecasts are unrelated
- The limit of predictability of the weather: about two weeks
- Hence ensembles: many forecasts from slightly different states; their spread says how much to trust them
But: each member is a full model. On which grid?
A single forecast is not enough: predict the uncertainty too
(Lorenz 1963; Kalnay 2003)
Finite differences and the pole problem
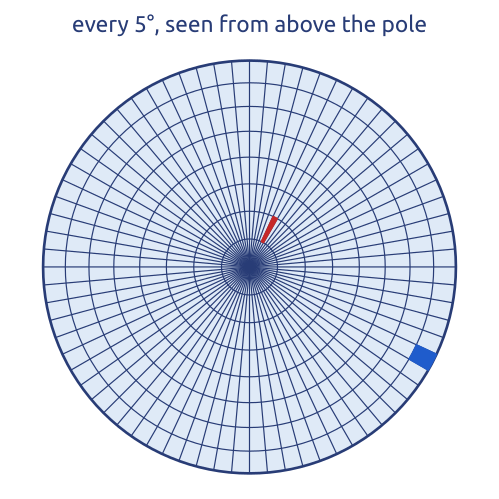
- 1960s–1980s: finite differences on latitude–longitude grids, as Richardson’s: GFDL, UCLA (Arakawa’s staggered grids), NCAR, NMC
- The meridians meet at the poles: the cells become thin wedges
- The CFL condition forces tiny time steps there; fixes: polar filters, fewer points near the poles
But: how small is “tiny”?
On a latitude–longitude grid, the cells at the poles set the time step of the whole model
(Staniforth and Thuburn 2012; Williamson 2007)
In class: the pole problem in numbers
Exercise 1 — The pole problem. A latitude–longitude grid with a spacing of \(0.25^\circ\) (\(1440\times720\) points). Compute the east–west spacing \(\Delta x = a\cos\varphi\,\Delta\lambda\) at the equator, at \(60^\circ\)N and in the last row, \(89.875^\circ\)N, and the largest stable explicit time step \(\Delta t = \Delta x/c\) for gravity waves with \(c = 300\) m/s.
| equator | \(60^\circ\)N | \(89.875^\circ\)N | |
|---|---|---|---|
| \(\Delta x\) | |||
| \(\Delta t = \Delta x / c\) |
\(a = 6371\) km, \(\;\Delta\lambda = 0.25^\circ = 4.36\times10^{-3}\) rad.
To hand in. A quasi-uniform grid with the same number of columns: its mean spacing \(\sqrt{4\pi a^2/N}\) and its time step. How many columns does a global grid of 1 km need?
In notebook 09a (❗ 6.1): open in Colab · download
(Staniforth and Thuburn 2012)
What the exercise showed
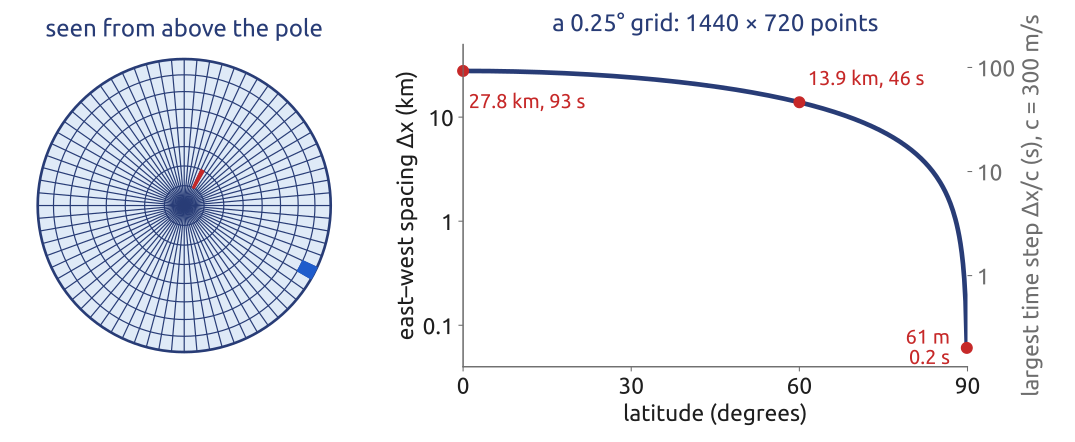
- \(\Delta x\): 27.8 km at the equator, 13.9 km at \(60^\circ\)N, 61 m in the last row; \(\Delta t\): 93 s, 46 s, 0.2 s
- A quasi-uniform grid with the same \(1.04\times10^6\) columns: mean spacing 22 km, \(\Delta t = 74\) s; a global 1 km grid needs \(5.1\times10^8\) columns
The last row near the pole sets the time step of the whole latitude–longitude model
(Staniforth and Thuburn 2012; Williamson 2007)
Semi-Lagrangian: follow the air back
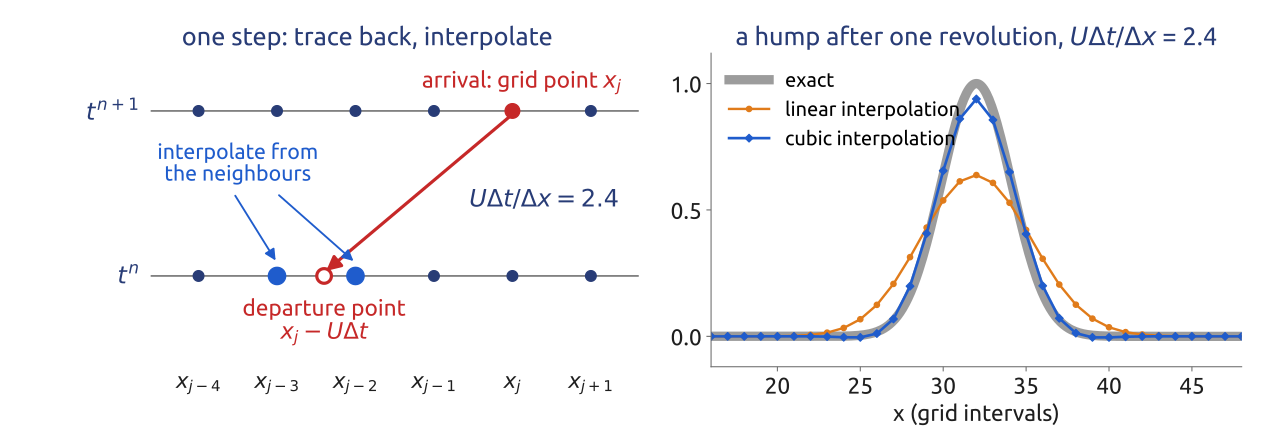
- The value arriving at \(x_j\) is the value at the departure point \(x_j - U\Delta t\), interpolated
- Stable for any Courant number \(U\Delta t/\Delta x\): the stencil moves with the departure point
- With semi-implicit gravity waves: steps of minutes at 9 km (SISL; Robert 1981)
- Linear interpolation damps; mass is not conserved exactly
\(x_j\): grid point \(j\); \(\Delta x\): grid spacing; \(U\): wind speed; \(\Delta t\): time step
CFL still holds: the trajectory puts the true domain of dependence inside the stencil
(Durran 2010, Sect. 7.1; Staniforth 1997)
The spectral era (1970s–today)
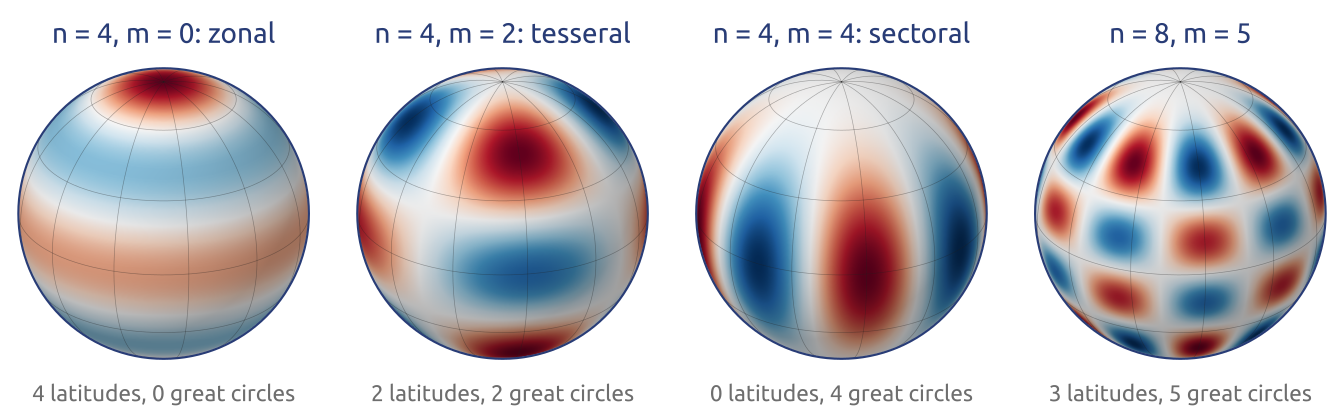
- Transform method (Orszag 1970; Eliasen et al. 1970): derivatives exact in spectral space, products on the grid: no pole problem
- Multi-level, semi-implicit (Bourke 1974; Hoskins and Simmons 1975): the Helmholtz problem of the gravity waves is diagonal in spherical harmonics
- ECMWF: spectral from 1983, semi-Lagrangian from 1991: steps of many minutes
- For forty years the method of most global forecasts
Spectral transforms removed the pole problem and made semi-implicit steps easy
(Orszag 1970; Eliasen et al. 1970; Bourke 1974; HOSKINS and SIMMONS 1975; Simmons et al. 1989; Ritchie et al. 1995)
The scalability problem
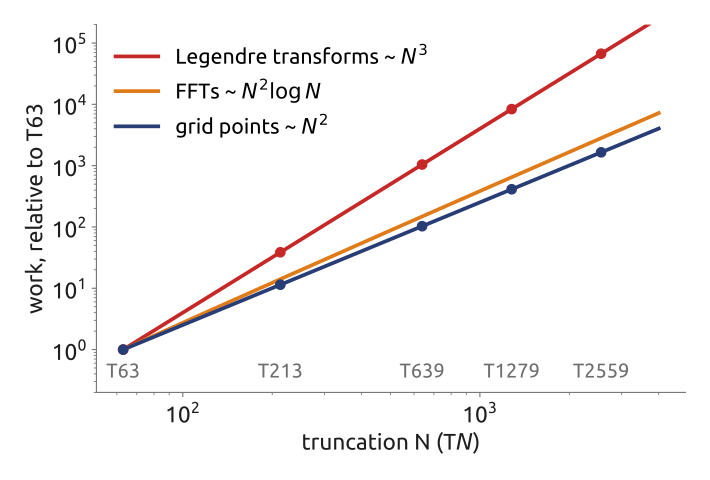
- A forecast must finish in about an hour, on machines of \(10^5\)–\(10^6\) cores
- Halve the spacing (double the truncation \(N\)): 4 times the grid points, 8 times the Legendre transforms
- Every transform needs data from the whole globe: global communication; so do the large linear solves of semi-implicit grid-point models
- “Fast” Legendre transforms delay it (Wedi et al. 2013); local methods avoid it
Spectral models do not scale on today’s computers: the reason for a new generation of models
(Williamson 2007; Wedi et al. 2013; Bauer et al. 2021)
The kilometre scale
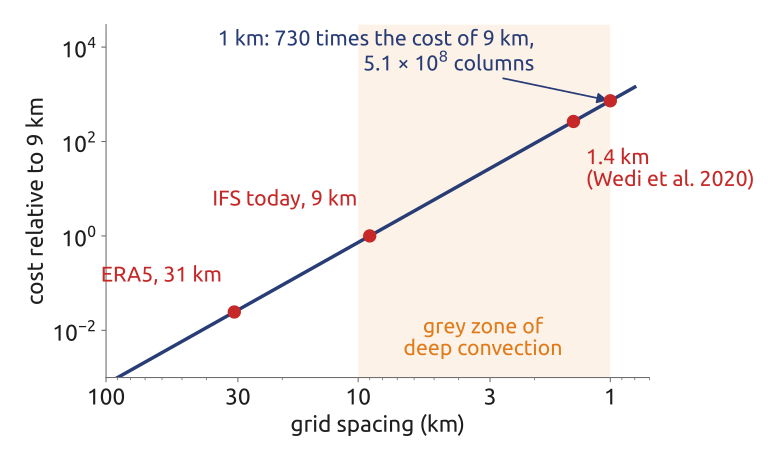
- Halve the grid spacing \(\Delta x\): 4 times the columns, half the time step (CFL): 8 times the cost
- At a few km, deep convection starts to be resolved: the “grey zone” of the parameterizations
- 1.4 km global IFS, a four-month simulation (Wedi et al. 2020)
- Codes reach about 5% of peak speed: memory and communication, not arithmetic, limit them; hence GPUs and local stencils
The kilometre scale costs about a thousand times today’s forecast: methods must scale
(Wedi et al. 2020; Bauer et al. 2021; Adams et al. 2019)
Three answers to the pole problem
1. Spectral transforms
Spherical harmonics have no pole problem: ECMWF’s IFS. The Legendre transforms grow costly at high resolution
2. Long time steps
Semi-implicit (fast waves implicit) and semi-Lagrangian (follow the flow back): steps much longer than an explicit Eulerian scheme allows (IFS, the Met Office’s ENDGame)
3. Quasi-uniform grids
Cells of nearly the same size everywhere: cubed sphere, icosahedral triangles, Voronoi hexagons
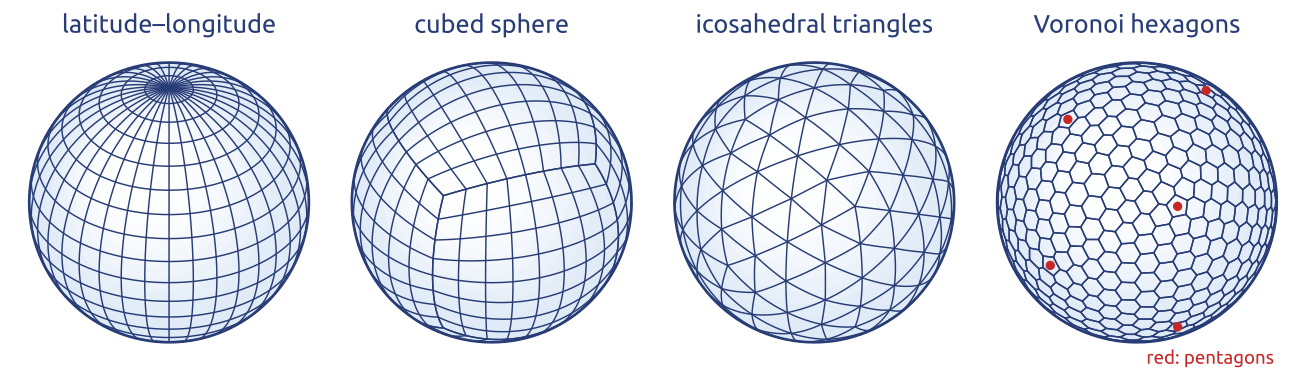
Change the basis, the time step, or the grid
(Staniforth and Thuburn 2012; Williamson 2007)
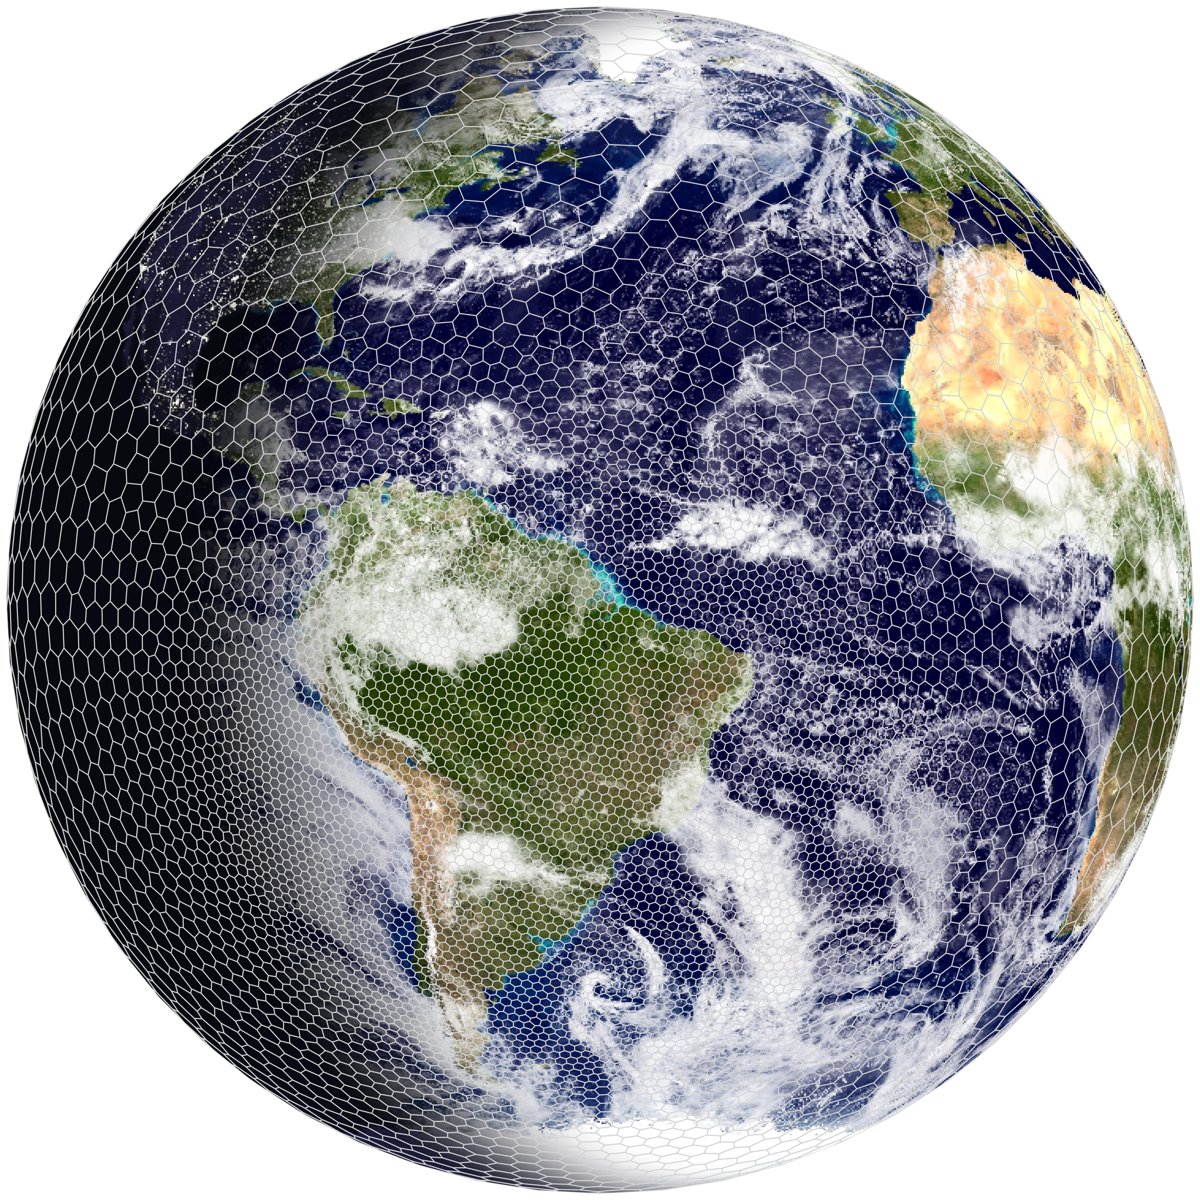
The new generation: quasi-uniform grids
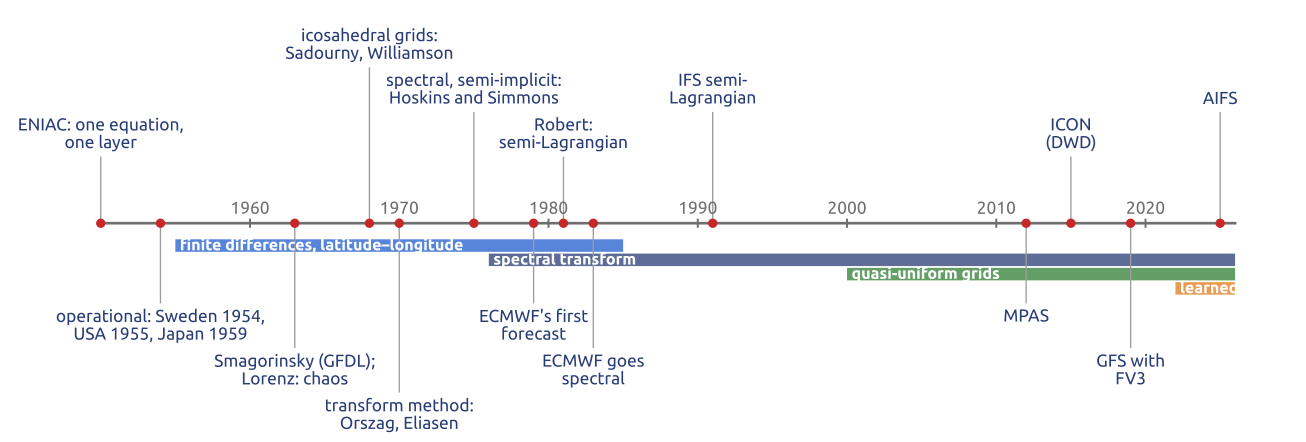
- An old idea: icosahedral grids in 1968 (Sadourny, Arakawa and Mintz; Williamson), not competitive then
- Since about 2000: cubed sphere (FV3, LFRic), icosahedral triangles (ICON), Voronoi (MPAS, MONAN)
- Local methods: finite volumes and finite elements, communication only with neighbours
- But: no grid on the sphere is perfect. What does each model choose?
Quasi-uniform grids and local operators: models built to scale
(SADOURNY et al. 1968; WILLIAMSON 1968; Staniforth and Thuburn 2012)
Notebook Grids on the sphere
Notebook 09a (open in Colab · download): build a grid like MONAN’s in a few lines of Python.
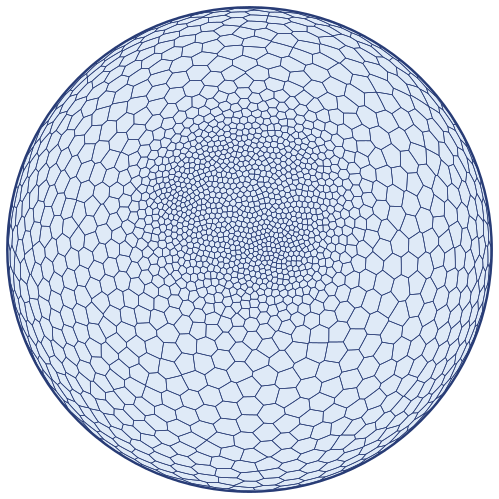
A Voronoi grid refined over the Alps
- Delaunay and Voronoi in the plane
- On the sphere: six points make a cube
- Icosahedral grids: hexagons and 12 pentagons
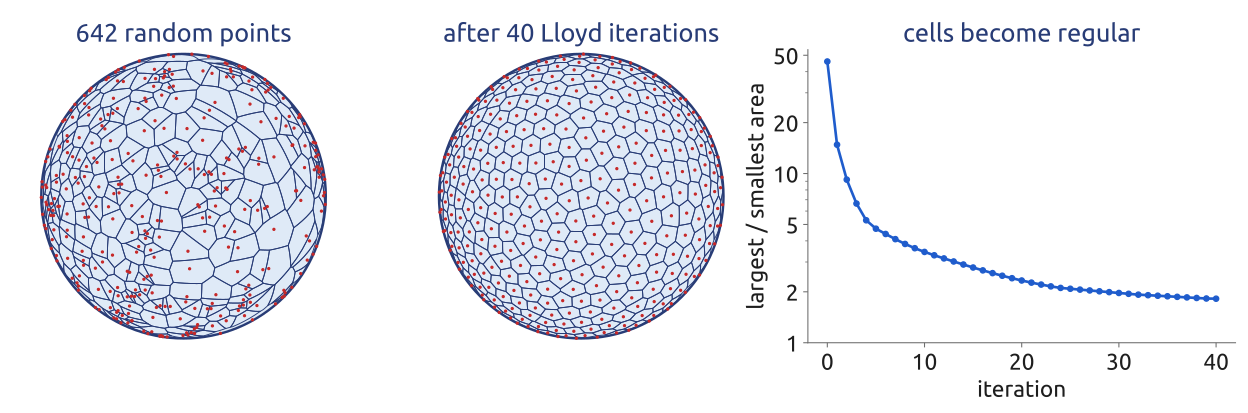
- Lloyd’s iterations: from random points to a regular grid
- Local refinement over the Alps ❗ 5.1
- The time step of the smallest cell; the pole problem ❗ 6.1
Predict, run, explain: how much smaller do the cells get for a density 256 times larger?
Build a grid like MONAN’s in a few lines of Python
(Ringler et al. 2011; Staniforth and Thuburn 2012)
What the notebook showed
- Icosahedral grids: \(10\cdot4^n+2\) cells; all hexagons except 12 pentagons
- Lloyd’s iterations: random points → a centroidal Voronoi grid
- Refinement: \(\Delta x \propto \rho^{-1/4}\) (density ×256, cells ÷4); the smallest cell sets the time step
- The same grids carry the vertical columns of the model
Quasi-uniform grids remove the pole problem; refinement puts the small cells where we want them
(Ringler et al. 2011)
Where the variables sit
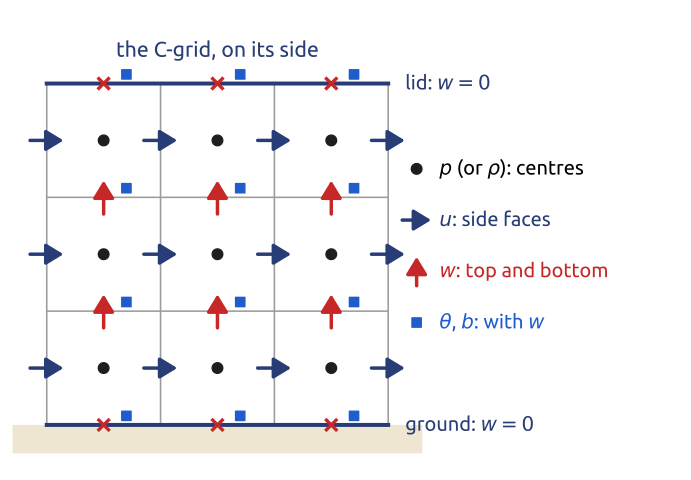
- The C grid, on its side: \(p\) at the centres, \(u\) on the side faces, \(w\) on the top and bottom faces
- \(\theta\) (or \(b\)) with \(w\): buoyancy acts on \(w\) with no averaging (Charney–Phillips)
- \(w = 0\) on the ground and the lid: imposed exactly, on the faces
- A slice model in vorticity form keeps \(\psi\), \(\xi\), \(b\) at the same points: it needs no staggering
\(u\), \(w\): horizontal and vertical velocity; \(p\): pressure; \(\theta\): potential temperature; \(b\): buoyancy; \(\psi\): streamfunction; \(\xi\): vorticity of the slice
The vertical has its own staggering choices, as the horizontal did
(Holdaway et al. 2013; Melvin et al. 2019)
Lorenz and Charney–Phillips grids
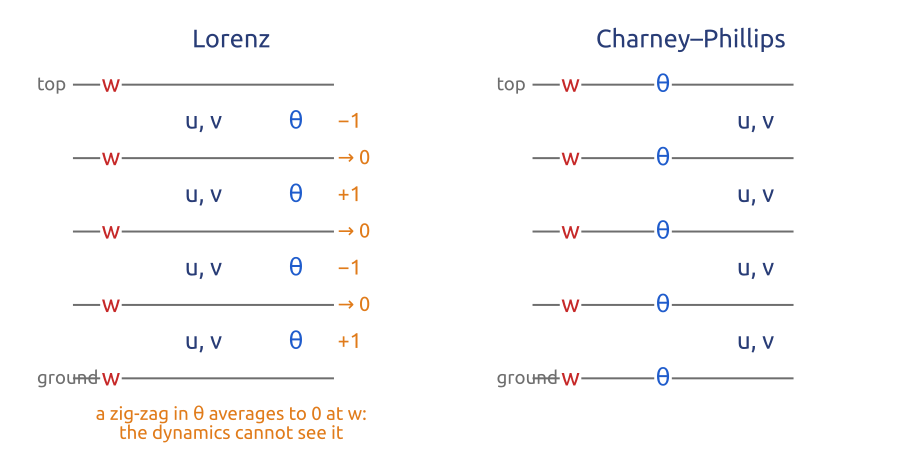
- Lorenz grid: \(\theta\) with the winds, \(w\) between: \(\theta\) must be averaged where buoyancy acts
- Charney–Phillips grid: \(\theta\) with \(w\): buoyancy where it is used
- Lorenz’s averaging hides a zig-zag in \(\theta\): a computational mode (as the A grid’s checkerboard)
\(u\), \(v\): horizontal velocity; \(w\): vertical velocity; \(\theta\): potential temperature
Staggering matters in the vertical too: Charney–Phillips for waves, Lorenz for conservation
(Holdaway et al. 2013)
The top of the model: let the waves out
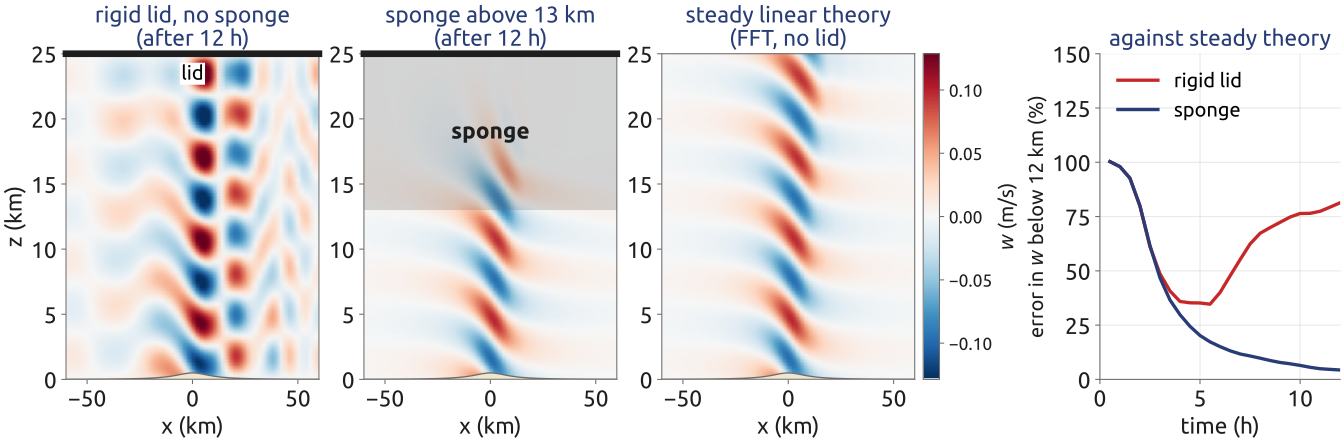
A rigid lid reflects the waves back down: a wrong, standing pattern (error 81% after 12 h). A sponge layer in the top 12 km, Rayleigh damping \(-\gamma(z)\,\xi\) and \(-\gamma(z)\,b'\), absorbs them (4%), if deep and gentle enough
\(\gamma(z)\): damping rate, zero below the sponge; \(\xi\): vorticity of the slice; \(b'\): buoyancy perturbation; \(w\): vertical velocity. A linear slice model: wind 10 m/s over a 100 m ridge (drawn 5 times higher)
A finite domain must let the waves leave: the sponge, a piece of numerics with no physics in it
(Klemp and Lilly 1978; Klemp et al. 2008)
Vertical coordinates
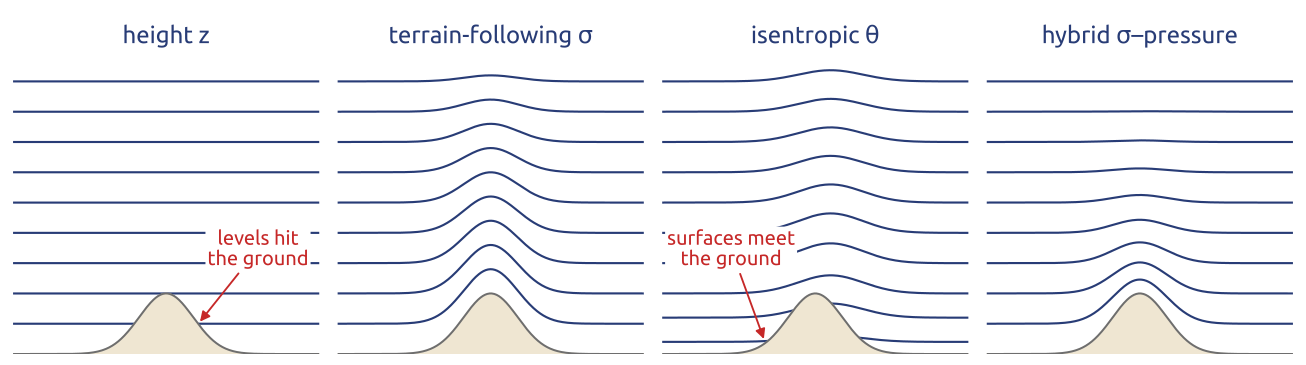
| height \(z\) | terrain-following \(\sigma\) | isentropic / isopycnal | hybrid | |
|---|---|---|---|---|
| + | simple, exact pressure gradient | smooth over mountains | follows the flow: little false mixing | follows the ground low down, flat aloft |
| − | steps at the ground | error over steep slopes | surfaces meet the ground | more complex |
\(z\): height; \(\sigma\): a terrain-following coordinate, constant on the ground; \(\theta\): potential temperature
No vertical coordinate is best everywhere: models mix them
(Gal-Chen and Somerville 1975; Schär et al. 2002; Griffies et al. 2000)
The pressure-gradient error of \(\sigma\) coordinates
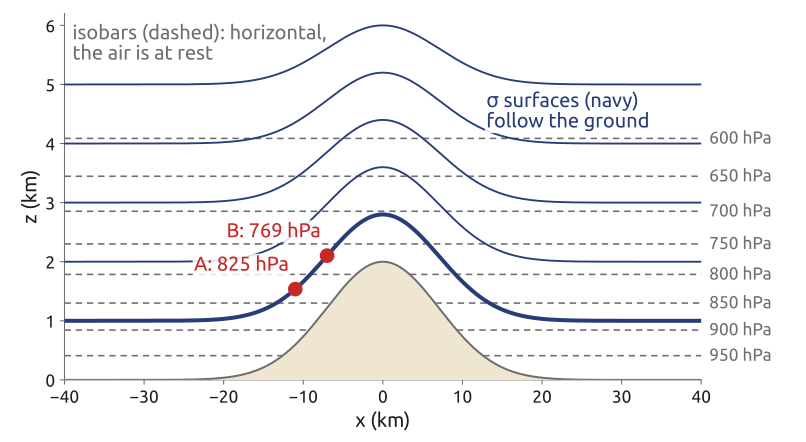
Along a sloping \(\sigma\) surface the model sees a difference of two large terms:
\[\nabla_z p = {\color{#1f5ccc}\nabla_\sigma p} - {\color{#c62828}\frac{\partial p}{\partial z}\,\nabla_\sigma z}\]
\(p\): pressure; \(z\): height; \(\nabla_z\), \(\nabla_\sigma\): horizontal gradients at constant \(z\) and at constant \(\sigma\)
- Here, from A to B: each term \(\approx 14\) hPa/km; true difference: 0 (rest)
- A weather gradient: 1 hPa per 100 km \(= 0.01\) hPa/km
- An error of 0.1% in either term is as large as the weather: a spurious wind
Following the terrain is convenient, but a small difference of large numbers is dangerous
(Haney 1991; Schär et al. 2002)
Schär’s mountain, and research at Polimi
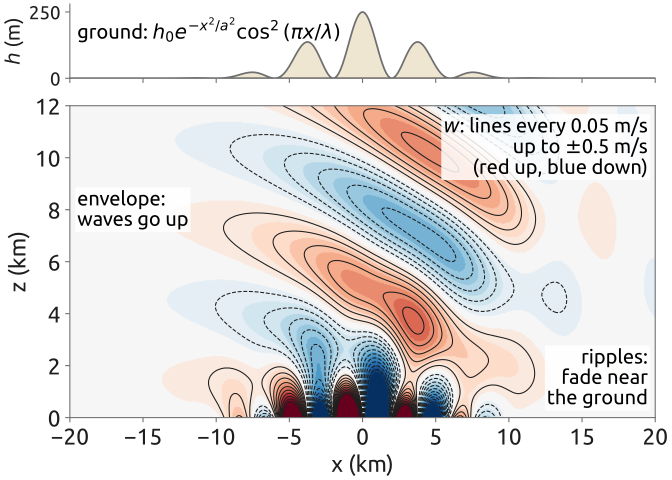
\(h_0 = 250\) m: peak height; \(a = 5\) km: envelope half-width; \(\lambda = 4\) km: ripple wavelength; \(w\): vertical velocity. Steady linear solution, wind 10 m/s
- Schär et al. (2002): a mountain with ripples. The ripples’ waves must fade; the envelope’s must go up
- A hard test for \(\sigma\) coordinates: SLEVE (smooth level vertical coordinate) flattens the coordinate surfaces aloft
- Other answers: cut cells (the ground cuts the grid cells), and local refinement with discontinuous Galerkin near the mountains (Orlando, Benacchio and Bonaventura 2024, MOX)
Mountains are still a research question for dynamical cores, here in Milan too
(Schär et al. 2002; Shaw and Weller 2016; Orlando et al. 2024)
The tests every new dynamical core must pass
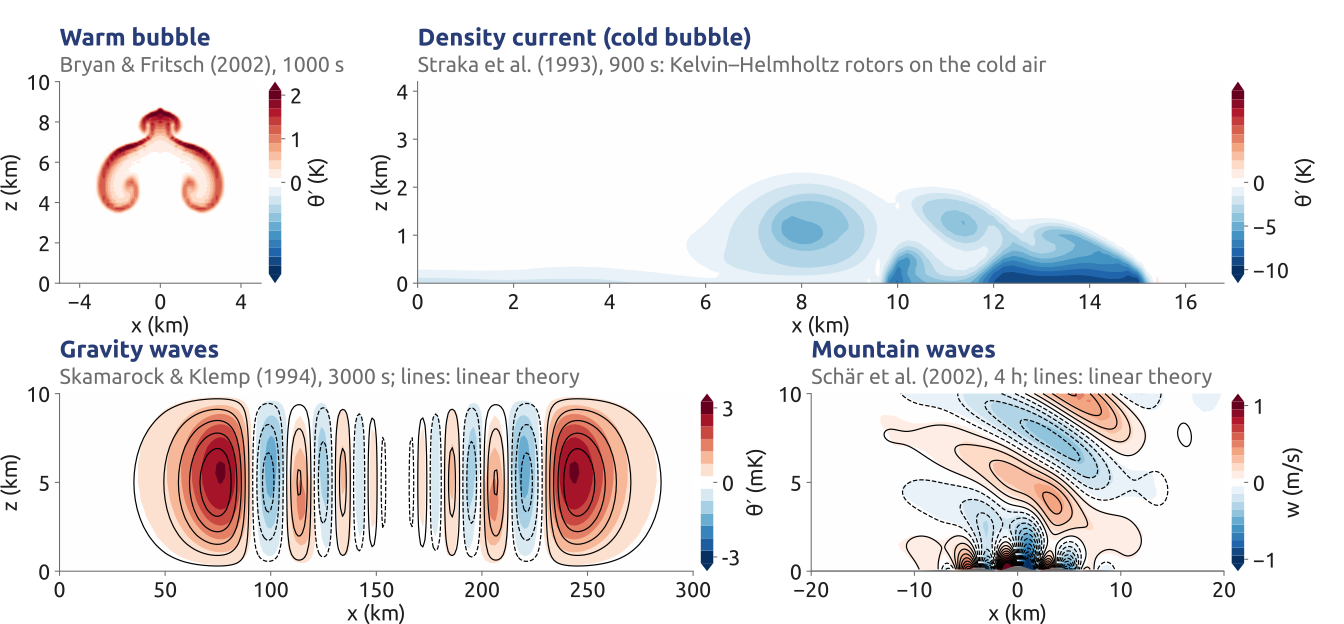
Shaded: Gusto runs of the compressible Euler equations; \(\theta'\): potential-temperature perturbation; \(w\): vertical velocity; lines: linear theory
Bubbles, density currents, gravity waves, mountains: the standard tests, here run with Gusto
(Bryan and Fritsch 2002; Straka et al. 1993; Skamarock and Klemp 1994; Schär et al. 2002)
A compressible core on Straka’s test
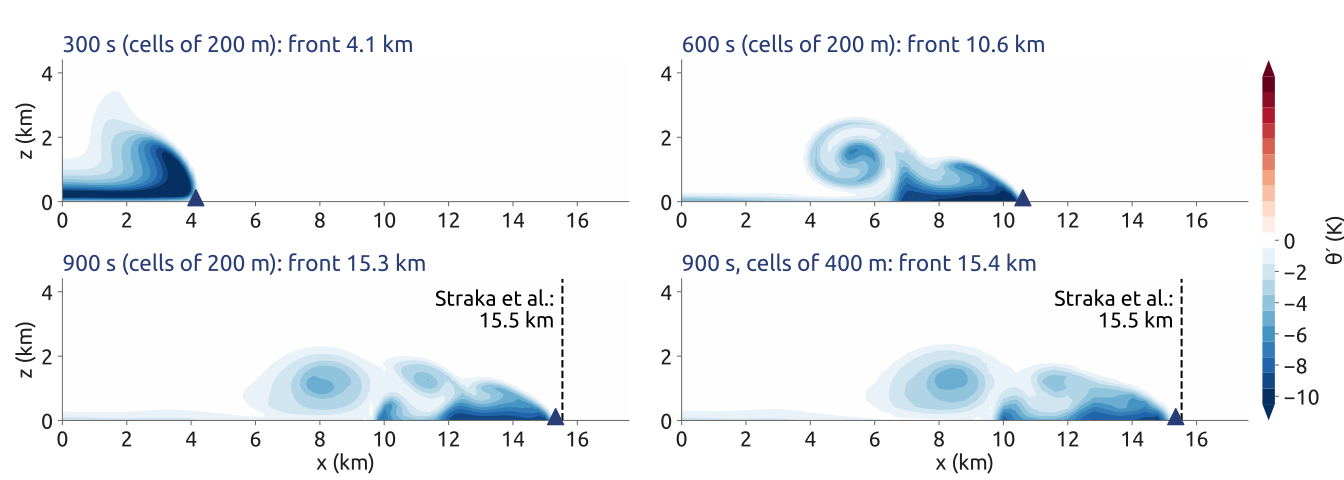
- Shaded: \(\theta'\), the potential-temperature perturbation; triangles: the front. Cells of 200 m: front at 15.3 km, 1.4% behind the reference (15.54 km); a Boussinesq slice model: 16.8 km, 8% ahead. The equations matter
- Gusto: velocity in \(H(\mathrm{div})\) (normal components continuous), \(\theta\) with \(w\) (Charney–Phillips); semi-implicit: one elliptic problem for the pressure per iteration
With the right equations and a converged reference, a model can be checked to the per cent
(Straka et al. 1993; Melvin et al. 2019; Natale et al. 2016)
What a weather app shows: four global models
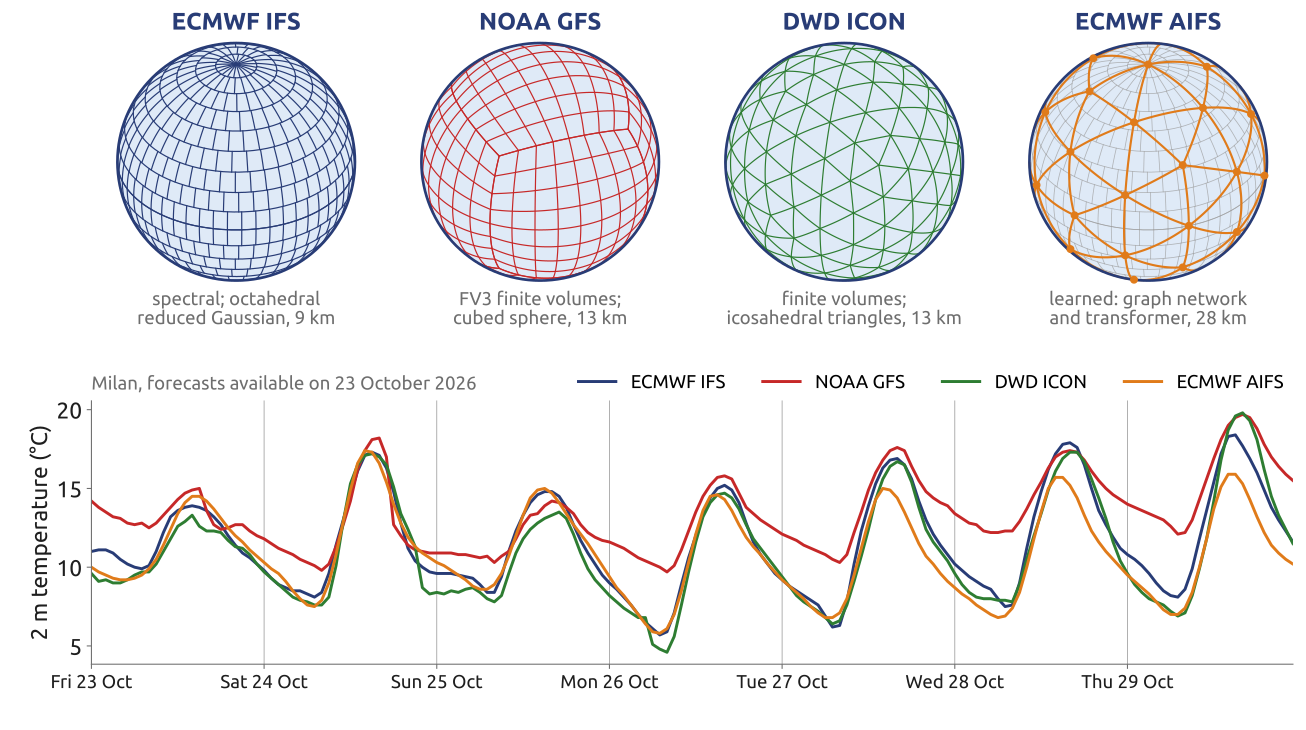
Windy.com shows the IFS, GFS, ICON and AIFS side by side: four grids, four methods, forecasts that differ by degrees
The forecast you read on your phone is one model among several, each with its own numerics
Data: open-meteo.com, forecasts available on 23 Oct. 2026 · App: windy.com
Ocean models (1/3): the first one, 1969
\[\frac{D\mathbf u}{Dt} + f\,\mathbf k\times\mathbf u = -\frac{1}{\rho_0}\nabla\,\delta p + \mathbf F,\qquad \frac{\partial\,\delta p}{\partial z} = \rho_0 b,\qquad \nabla\cdot\mathbf u + \frac{\partial w}{\partial z} = 0\] \[\frac{DT}{Dt} = Q_T,\qquad \frac{DS}{Dt} = Q_S,\qquad b = b(T, S, z),\qquad {\color{#1f5ccc}w|_{z=0} = 0}\ \text{(rigid lid)}\]
\(\mathbf u = (u, v)\), \(w\): horizontal and vertical velocity; \(f\): Coriolis parameter; \(\rho_0\): reference density; \(\delta p\): pressure departure; \(b\): buoyancy; \(T\), \(S\): temperature, salinity; \(Q_T\), \(Q_S\), \(\mathbf F\): eddy mixing
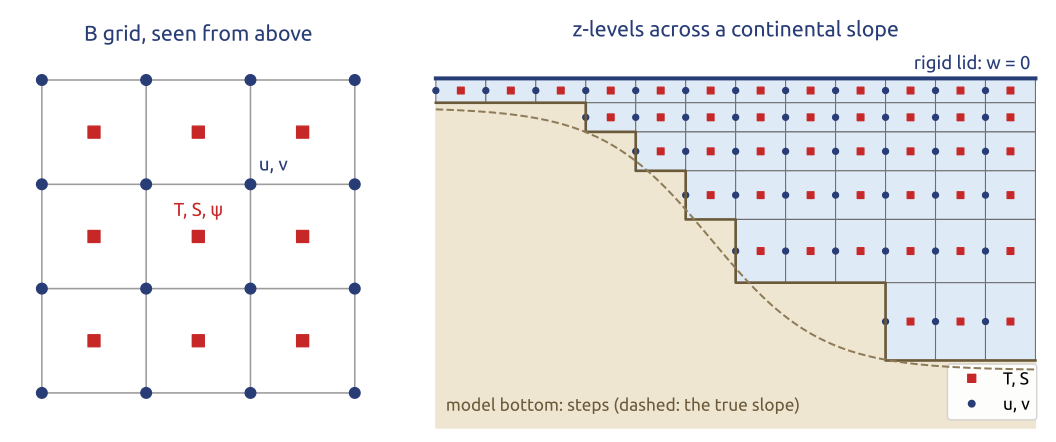
- Kirk Bryan, GFDL: the world ocean with coasts and bottom topography; z-levels, the B grid
- Rigid lid: no fast surface gravity waves (about 200 m/s); the depth-integrated flow from a streamfunction \(\psi\): an elliptic problem every step
- Manabe and Bryan (1969): the first coupled model; Bryan, Cox and Semtner’s code became GFDL’s MOM
1969: primitive equations on z-levels, a rigid lid, and an elliptic solve each step
(Bryan 1969; Manabe and Bryan 1969; Griffies et al. 2000)
Ocean models (2/3): the vertical coordinate
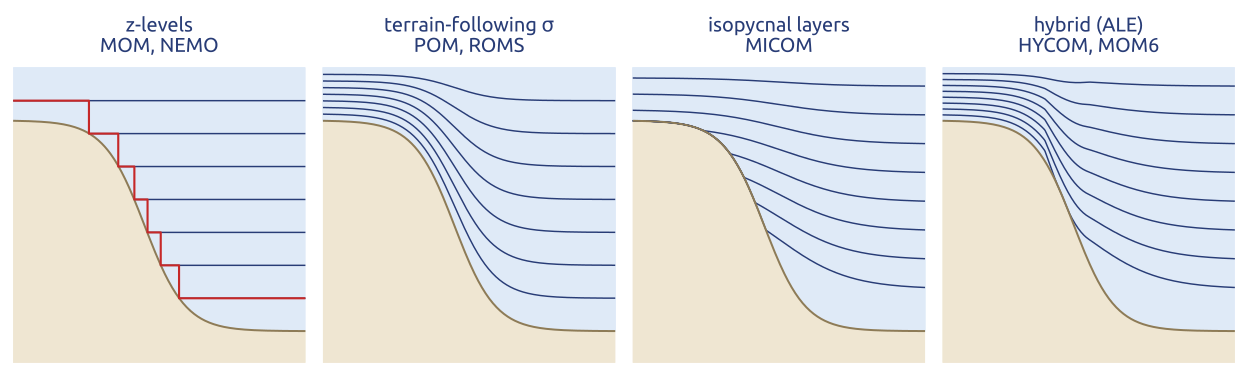
- z-levels (MOM, OPA/NEMO): simple, an exact horizontal pressure gradient; steps at the bottom, eased by partial steps
- Terrain-following \(\sigma\) (POM, ROMS): smooth over shelves and slopes, for coasts; the \(\sigma\) pressure-gradient error over steep slopes
- Isopycnal (MICOM): layers are density surfaces: no spurious mixing across them; they vanish where they outcrop
- Hybrid, ALE (arbitrary Lagrangian–Eulerian; HYCOM, MOM6): \(z\) near the surface, isopycnal inside, \(\sigma\) on the shelf
- A free surface replaces the rigid lid: a split-explicit barotropic mode (POM, ROMS)
Thirty years of debate on one choice: how the layers of the model follow the ocean
(Griffies et al. 2000; Blumberg and Mellor 1987; Shchepetkin and McWilliams 2005; Bleck 2002)
Ocean models (3/3): the grids of today
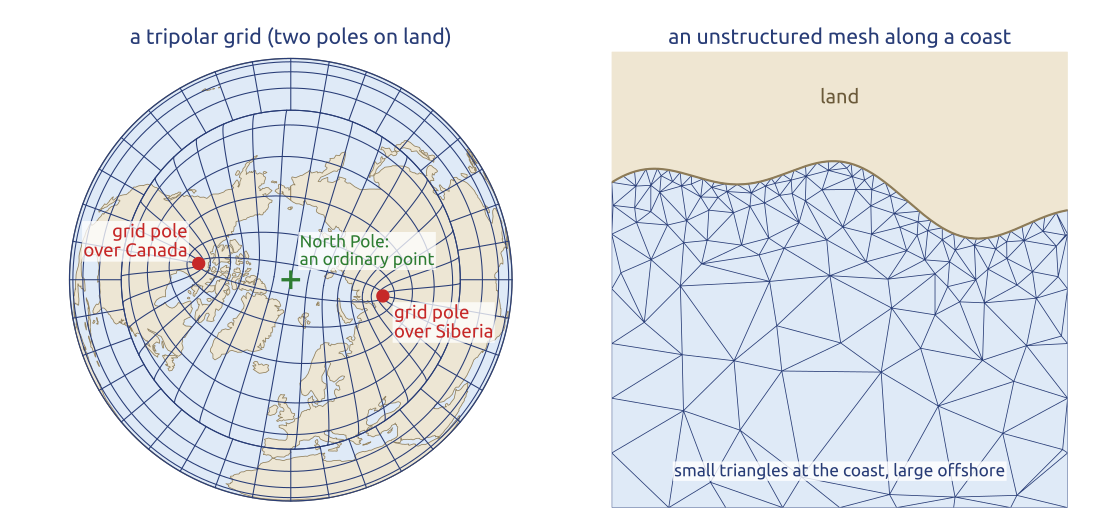
- The ocean’s pole problem is the North Pole, in the Arctic Ocean. Tripolar grids (Murray 1996) move the two northern grid poles onto land: NEMO’s ORCA grids, GFDL’s MOM
- MOM6 (Adcroft et al. 2019): C grid, a vertical Lagrangian-remap (ALE) coordinate, at \(1/4^\circ\) and \(1/2^\circ\)
- Unstructured meshes: FESOM2 (finite volumes), MPAS-Ocean (Voronoi), ICON-O (triangular C grid): small cells along coasts and straits, large ones elsewhere
- How fine? Gulf Stream simulations at \(1/8^\circ\) to \(1/64^\circ\) (Hurlburt and Hogan 2000)
Ocean grids moved their poles onto land, and their small cells to where the coasts are
(Murray 1996; Madec et al. 2026; Adcroft et al. 2019; Danilov et al. 2017; Ringler et al. 2013; Korn 2017; Hurlburt and Hogan 2000)
The ocean’s eddies set the grid
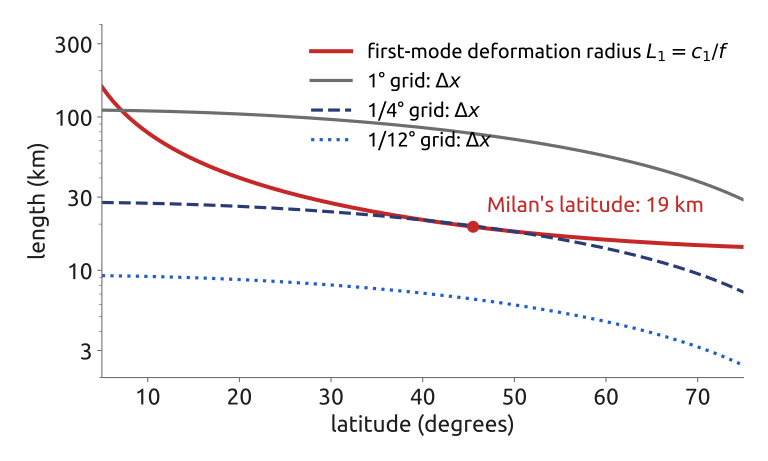
- Ocean eddies have the size of the first-mode deformation radius \(L_1 = c_1/f\) (\(c_1 \approx 2\) m/s: about 20 km at Milan’s latitude), against ~1000 km for the atmosphere’s cyclones
- At 45°N a \(1/4^\circ\) grid has about one cell per \(L_1\) (too coarse); a \(1/12^\circ\) grid has about three: \(L_1/\Delta x\) decides
\(c_1\): speed of the first baroclinic mode; \(f\): Coriolis parameter; \(\Delta x\): grid spacing
The ocean’s weather is ten times smaller: ocean models need ten times finer grids
(Vallis 2017; Cushman-Roisin and Beckers 2011)